Lucky Block Price Prediction: LBLOCK/USD Aims for Higher Levels
Estimated Reading Time: 3 minutes
Don’t invest unless you’re prepared to lose all the money you invest. This is a high-risk investment and you are unlikely to be protected if something goes wrong. Take 2 minutes to learn more
Lucky Block Price Prediction – August 31
The Lucky Block price keeps hovering above the 9-day and 21-day moving averages, a breakout above this barrier could trigger an increase.
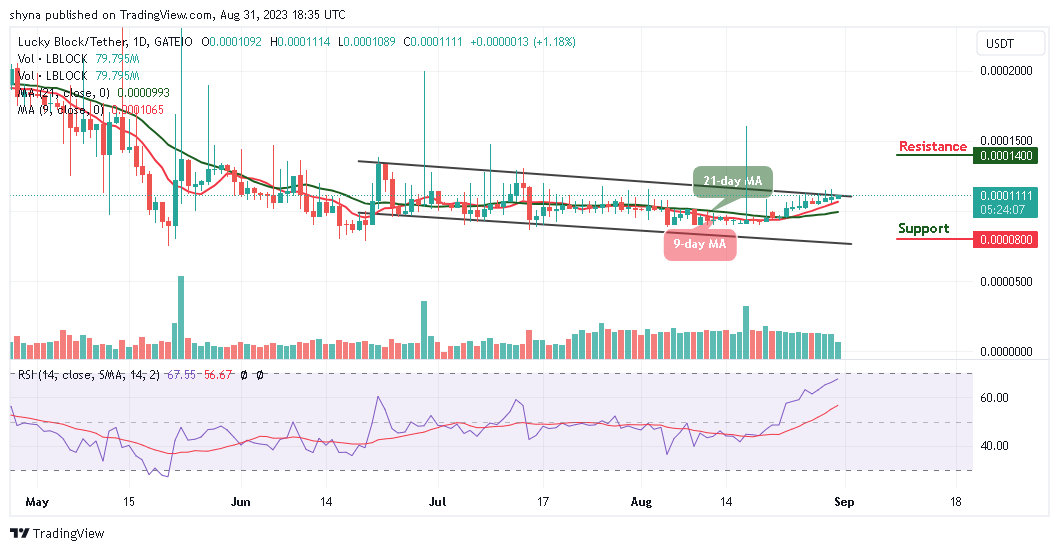
LBLOCK/USD Long-term Trend: Ranging (Daily Chart)
Key Levels:
Resistance levels: $0.000140, $0.000150, $0.000160
Support levels: $0.000080, $0.000070, $0.000060
LBLOCK/USD keeps following the bullish movement as the buyers gain control of the market. The 1.18% gain in volatility is leveling up the trading price to touch the resistance level of $0.000112. However, the Lucky Block price will cross above the upper boundary of the channel to hit the nearest resistance level of $0.000120.
Lucky Block Price Prediction: LBLOCK Would Move Upward
According to the daily chart, the Lucky Block price continues to trade above the 9-day and 21-day moving averages. Therefore, traders may see more climbs in the next few positive directions if the coin crosses above the channel to hit the resistance levels of $0.000140, $0.000150, and $0.000160.
In the meantime, if the Lucky Block price drops and heads toward the lower boundary of the channel, the $0.000100 level could provide support for a possible bearish retracement. But if not, the coin may further test the support levels of $0.000080, $0.000070, and $0.000060. Looking at the technical indicator Relative Strength Index (14), the signal line is moving into the overbought region which suggests that more bullish signals will play out.
LBLOCK/USD Medium-term Trend: Bullish (4H Chart)
On the 4-hour chart, Lucky Block (LBLOCK) has been moving bullishly as the market price trades at $0.000111. The Lucky Block price is now contained on the positive side as traders expect the bulls to hopefully push the market higher but at the time of writing, the Relative Strength Index (14) is crossing into the overbought region.
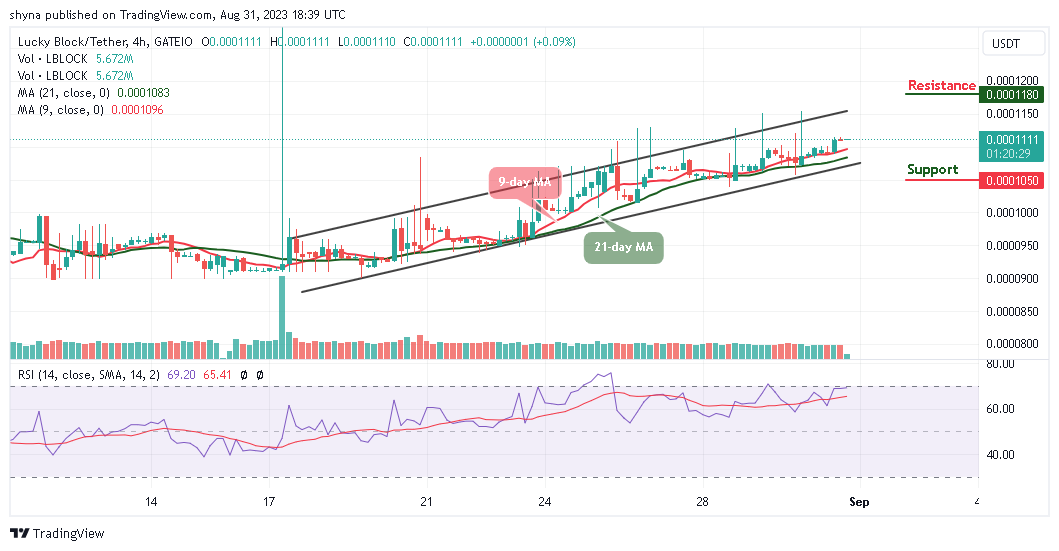
However, if the bulls keep the price above the 9-day moving average, traders can expect initial resistance at $0.000114. Above this, higher resistance lies at $0.000118 and above. On the contrary, if the sellers bring the market below the lower boundary of the channel, the market may hit the support level at $0.000105 and below.
You can purchase Lucky Block here. Buy LBLOCK