Lucky Block Price Prediction: LBLOCK/USD Surges Above $0.000210 Level
Estimated Reading Time: 2 minutes
Don’t invest unless you’re prepared to lose all the money you invest. This is a high-risk investment and you are unlikely to be protected if something goes wrong. Take 2 minutes to learn more
Lucky Block Price Prediction – October 31
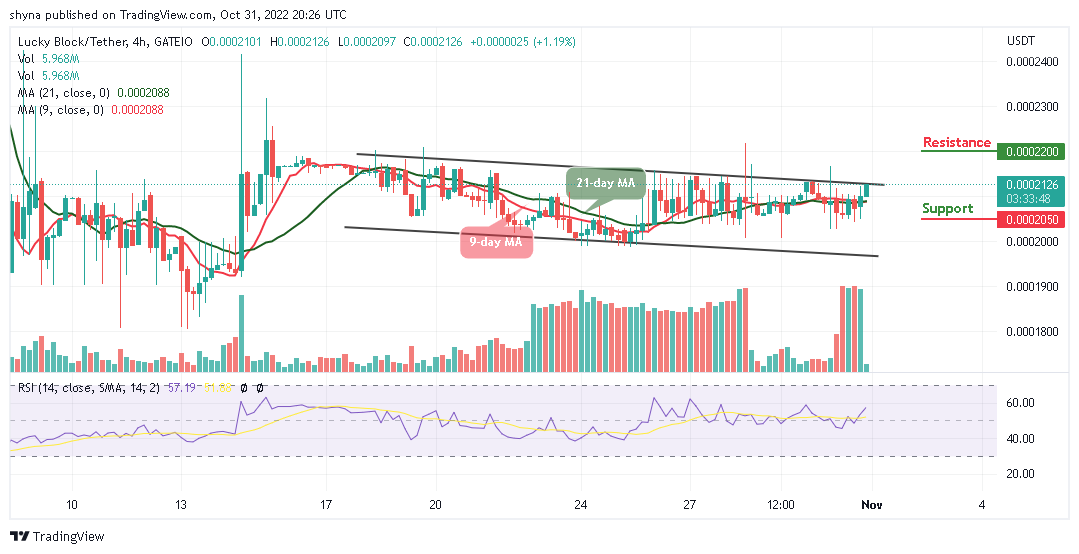
The Lucky Block price prediction is moving to cross above the upper boundary of the channel for confirmation of the bullish movement.
LBLOCK/USD Medium-term Trend: Ranging (4H Chart)
Key Levels:
Resistance levels: $0.000220, $0.000225, $0.000230
Support levels: $0.000205, $0.000200, $0.000195
LBLOCK/USD is trading above the 9-day and 21-day moving averages as the coin moves to cross above the upper boundary of the channel. Looking at the daily chart, the Lucky Block price is going to face the upside as traders anticipate the current price movement indicating the upcoming price rally in the market.
Lucky Block Price Prediction: LBLOCK/USD Heads to the Positive Side
As the Lucky Block price crosses above the moving averages, the coin will claim the resistance level of $0.000215 to face the potential resistance levels of $0.000220, $0.000225, and $0.000230. Meanwhile, as the technical indicator Relative Strength Index (14) moves to cross above the 60-level, if the bulls failed to push the coin to the north, the support levels of $0.000205, $0.000200, and $0.000195 may come to focus.
LBLOCK/USD Medium-term Trend: Bearish (2H Chart)
The Lucky Block price is already hovering above the 9-day and 21-day moving averages, and the coin is heading toward the lower boundary of the channel. However, the technical indicator Relative Strength Index (14) is moving to cross above the 60-level as the existing buyers dominate the market.
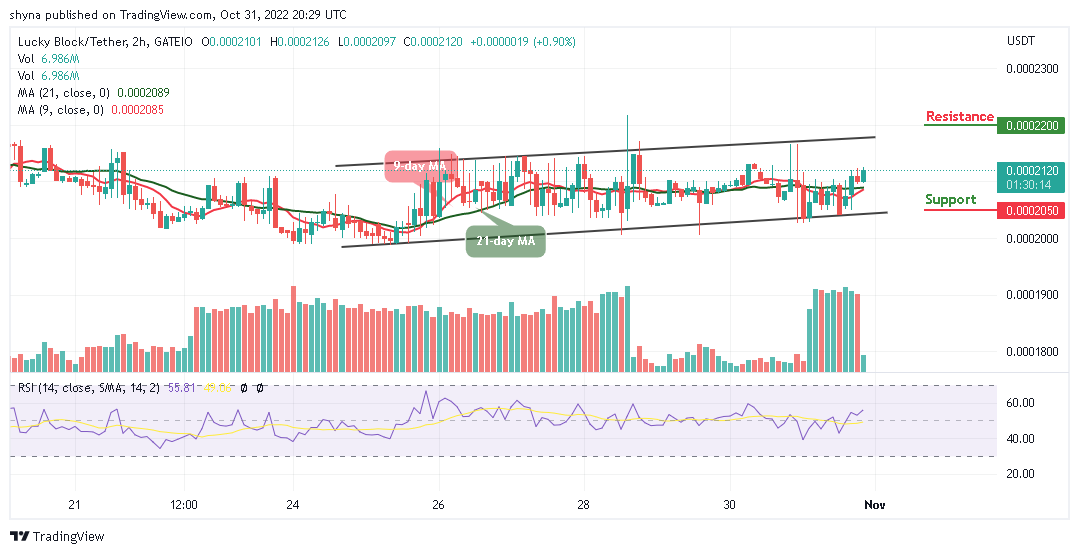
Moreover, if the bulls push the market price above the upper boundary of the channel, the Lucky Block would hit the potential resistance level of $0.000220 and above. On the contrary, any bearish movement below the lower boundary of the channel can hit the support level at $0.000205 and below.
You can purchase Lucky Block here. Buy LBLOCK