Investors Panic as Critical Polkadot Support Levels Fail: What’s Next?
Estimated Reading Time: 3 minutes
Don’t invest unless you’re prepared to lose all the money you invest. This is a high-risk investment and you are unlikely to be protected if something goes wrong. Take 2 minutes to learn more

Polkadot against Tether has continued its downward trajectory, falling 1.22% daily and over 18% weekly. As it stands, this decline appeared to be fueled by a broad market sell-off and extreme fear sentiment, as the breach of Polkadot support levels sent panic down investors’ spines.
Technically, DOT has breached its critical $1.50 support level. Despite occupying an oversold region, the price remains suppressed by institutional skepticism toward interoperability tokens as the market view shifts toward Layer-2 solutions.
Currently, Polkadot trades at $1.464, with a daily trading volume of more than 2.07 million.
Technical Indicators
Major Resistance Levels: $1.750, $2.000, and $2.250
Major Support Levels: $1.400, $1.300, and $1.000
Technical Analysis
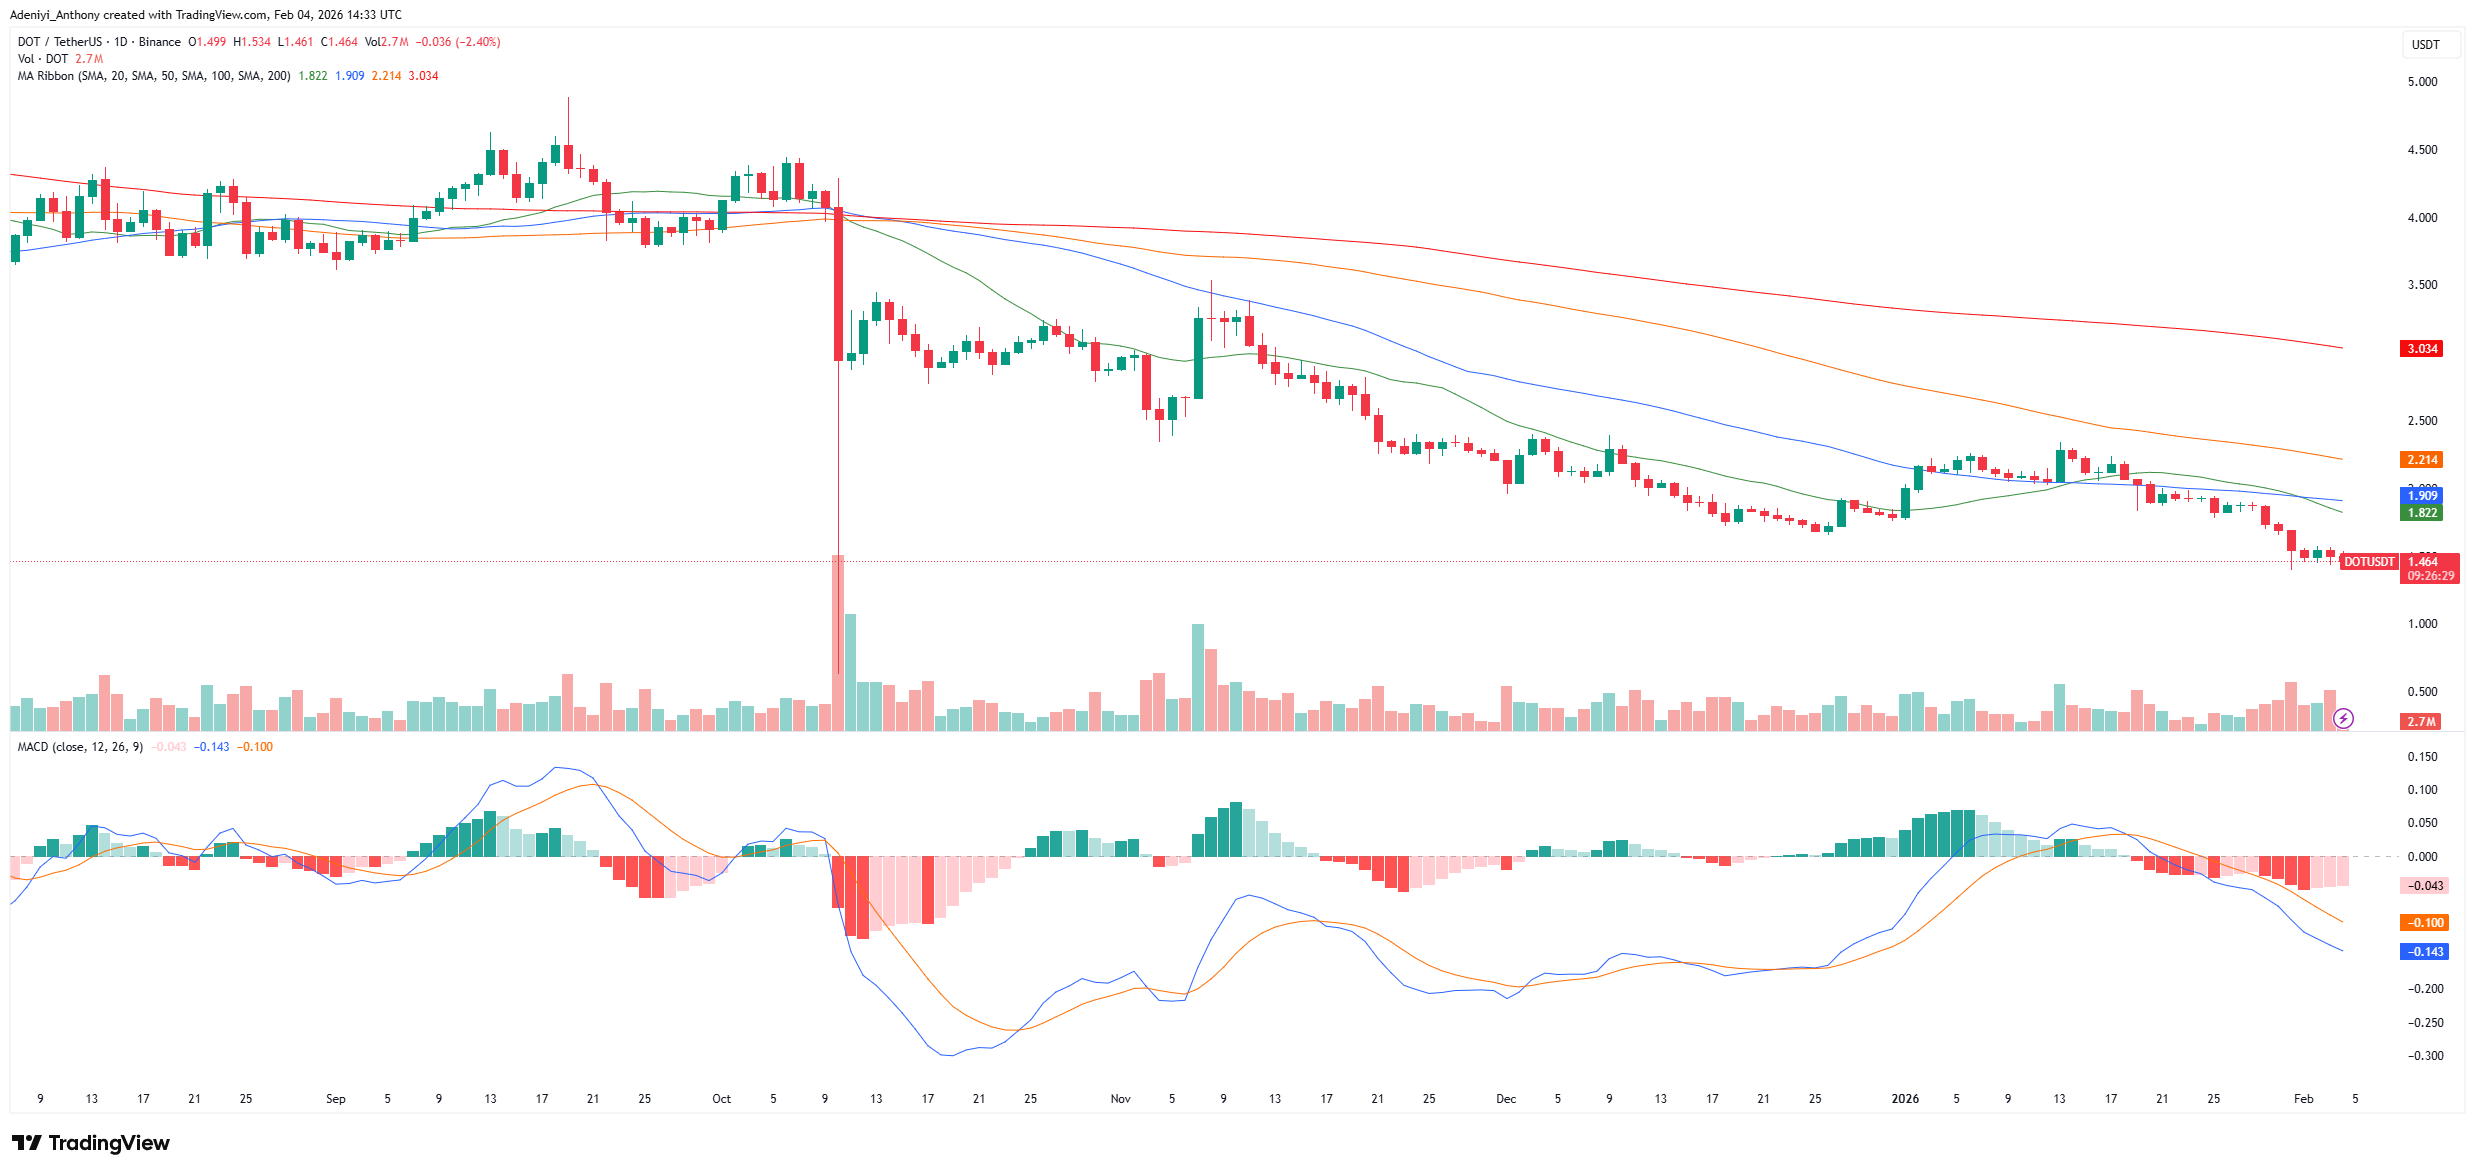
Technically, Polkadot against Tether on the daily chart appears to be locked in a firm bearish cycle, with the price breaking below the anticipated Polkadot support level. As it stands, the price operates below the cluster of simple moving averages, denoting sustained sell pressure as the bears make a move for a level below $1.450.
However, the signal from the MACD suggests bearish momentum is waning as the price action suggests a prolonged downtrend. To this end, the price can only move to the north if bullish participation improves above $1.620. Conversely, a move below $1.450 may suggest $1.300 as the next support level.
Polkadot Project Scary Chart
Polkadot is currently navigating a period of intense capitulation. The price appears to be compressing into a multi-month falling wedge after a flush toward $1.50. Meanwhile, despite the bearish momentum, the macro structure remains technically intact as long as DOT holds the critical 2.618 Fibonacci level at $1.37. A weekly close below this do-or-die support would invalidate the current cycle’s bullish thesis and likely trigger a deeper drop toward $0.85. However, fundamental news suggests relief above a Polkadot support level is coming soon.
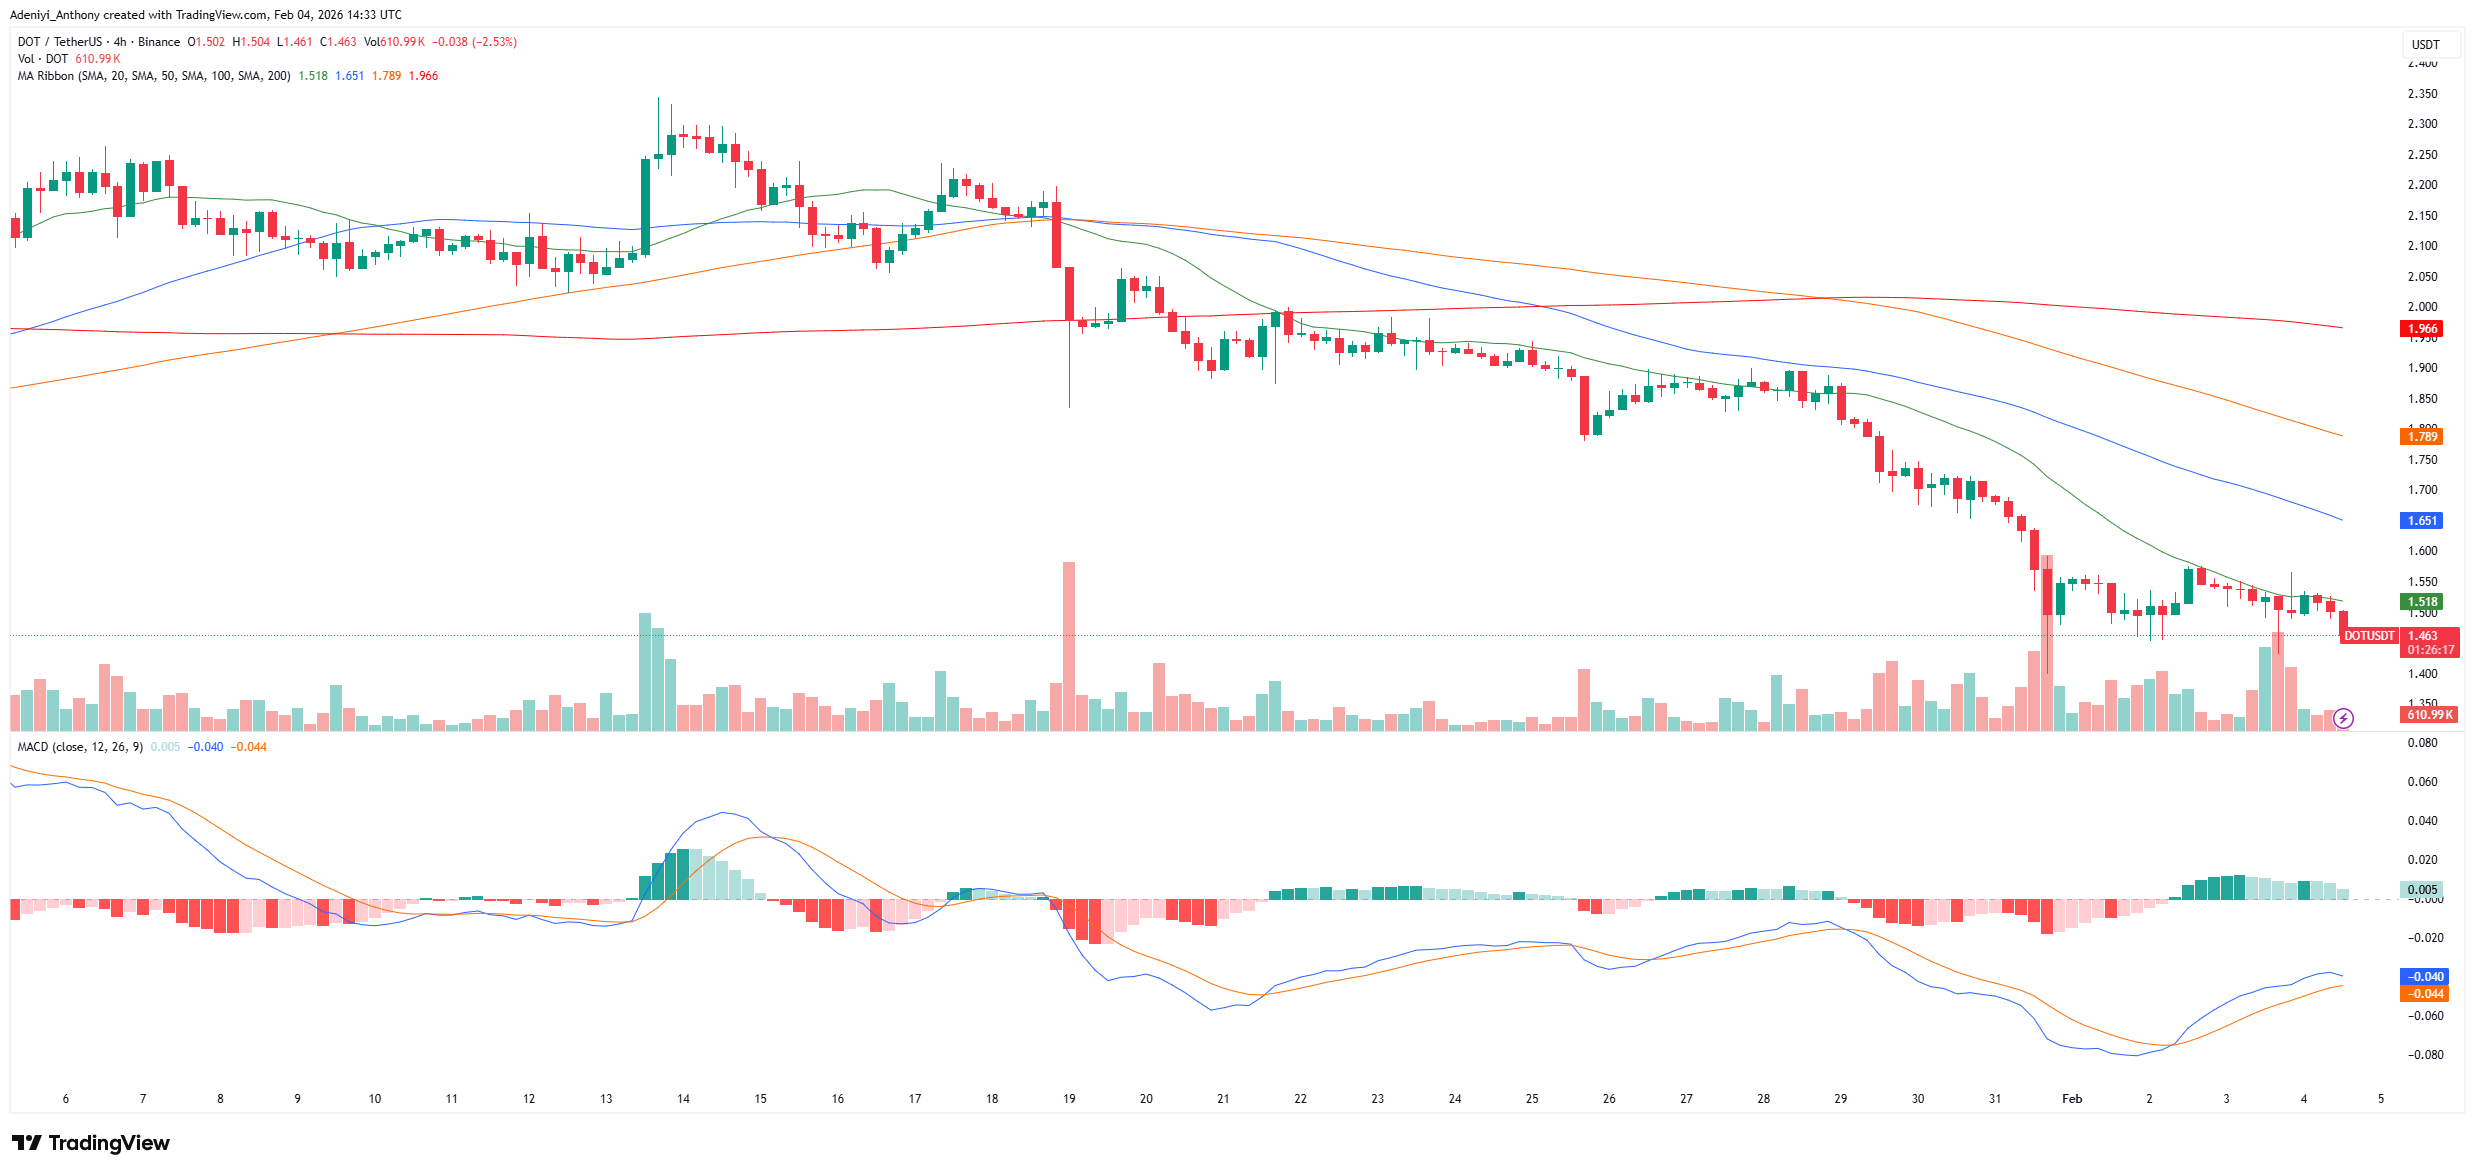
DOT/USDT Analysis: Short-Term Polkadot Support Level Provides Stability
On the 4-hour chart, DOT/USDT is showing signs of exhaustion from the sellers. Though the price is still below the SMA, recent price action suggests stability. However, the short-period MACD signals buying momentum is not enough to push the price upside. Meanwhile, the narrative may change provided the bulls increase participation.
To this end, if the bulls cannot reclaim the $1.62 in the coming session, another critical Polkadot support level may be broken.
You can purchase crypto coins here. Buy Crypto