Lucky Block Price Prediction: LBLOCK/USD Touches $0.000115 Resistance
Estimated Reading Time: 3 minutes
Don’t invest unless you’re prepared to lose all the money you invest. This is a high-risk investment and you are unlikely to be protected if something goes wrong. Take 2 minutes to learn more
Lucky Block Price Prediction – August 30
The Lucky Block price shows that LBLOCK is keeping its upward movement as the buyers move the coin to a new height.
LBLOCK/USD Long-term Trend: Ranging (Daily Chart)
Key levels:
Resistance Levels: $0.000130, $0.000140, $0.000150
Support Levels: $0.000090, $0.000080, $0.000070
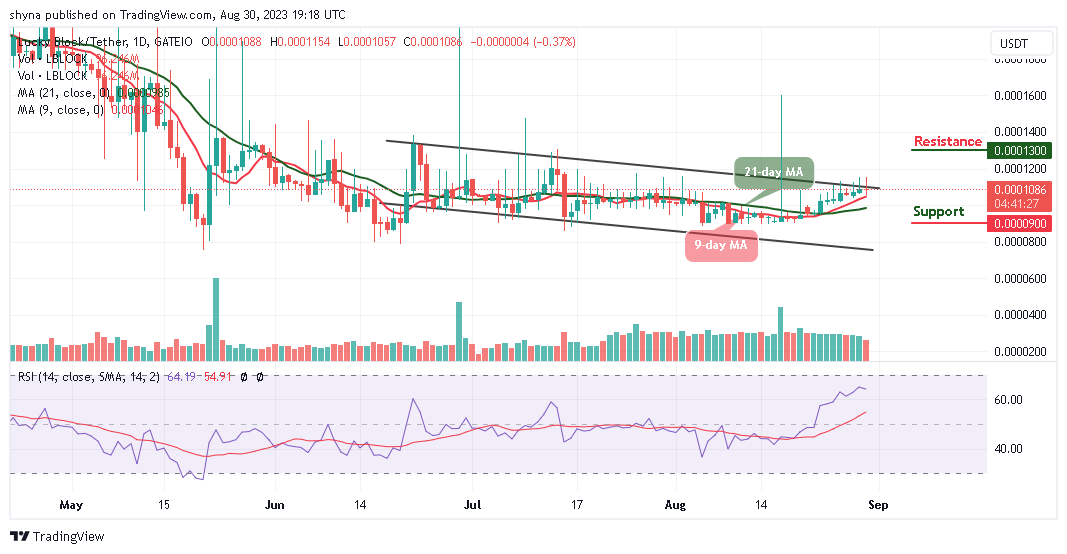
LBLOCK/USD has been increasing slowly since the past few days, touching the daily high at $0.000115 above the 9-day and 21-day moving averages. Looking at the daily chart, the Lucky Block price has risen after a bullish rally a few days ago. At the time of writing, bulls are now gathering momentum with a current movement around the upper boundary of the channel, which is heading toward a resistance level of $0.000120.
Lucky Block Price Prediction: LBLOCK Will Spike to the Upside
As the Lucky Block price keeps heading to the upside, it is likely to remain above the 9-day and 21-day moving averages while the technical indicator Relative Strength Index (14) keeps hovering above the 60-level. However, should in case the price exceeds the indicated level, then, the resistance levels of $0.000130, $0.000140, and $0.000150 will be visited.
Nevertheless, for a backward movement, the market could be supported at levels of $0.000105 and $0.000100 and if the price falls below the previous level, other critical supports could be around $0.000090, $0.0000080, and $0.000070 respectively, which could allow more buyers to invest in the coin.
LBLOCK/USD Medium-Term Trend: Bullish (4H Chart)
Looking at the 4-hour chart, the Lucky Block price is now following the upward trend as traders could see enough positive movement in no time. On the other hand, the LBLOCK/USD market is following an ascending broadening wedge formation as the bull gains ground. However, an escape must occur as the technical indicator Relative Strength Index (14) stays above the 60-level, suggesting additional bullish signals into the market.
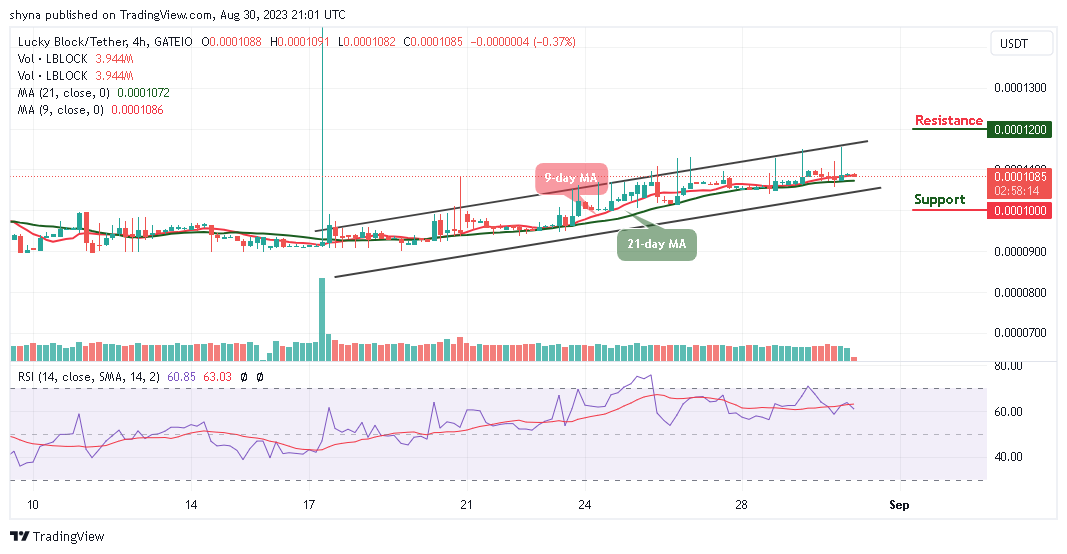
As it appears in the daily chart, a slow progression is taking place, which could be reflected in the market. Meanwhile, breaking toward the channel’s upper boundary could further open the way for an upward movement. If such a scenario comes to play out, the closest resistance level for a possible inclination could be $0.000120 and above while the critical support could be located at $0.000100 and below.
You can purchase Lucky Block here. Buy LBLOCK