BNB (BNB/USDT) Tests the $660 Line, Seeks Further Gains
Estimated Reading Time: 3 minutes
Don’t invest unless you’re prepared to lose all the money you invest. This is a high-risk investment and you are unlikely to be protected if something goes wrong. Take 2 minutes to learn more
BNB Long-term Analysis: Bullish
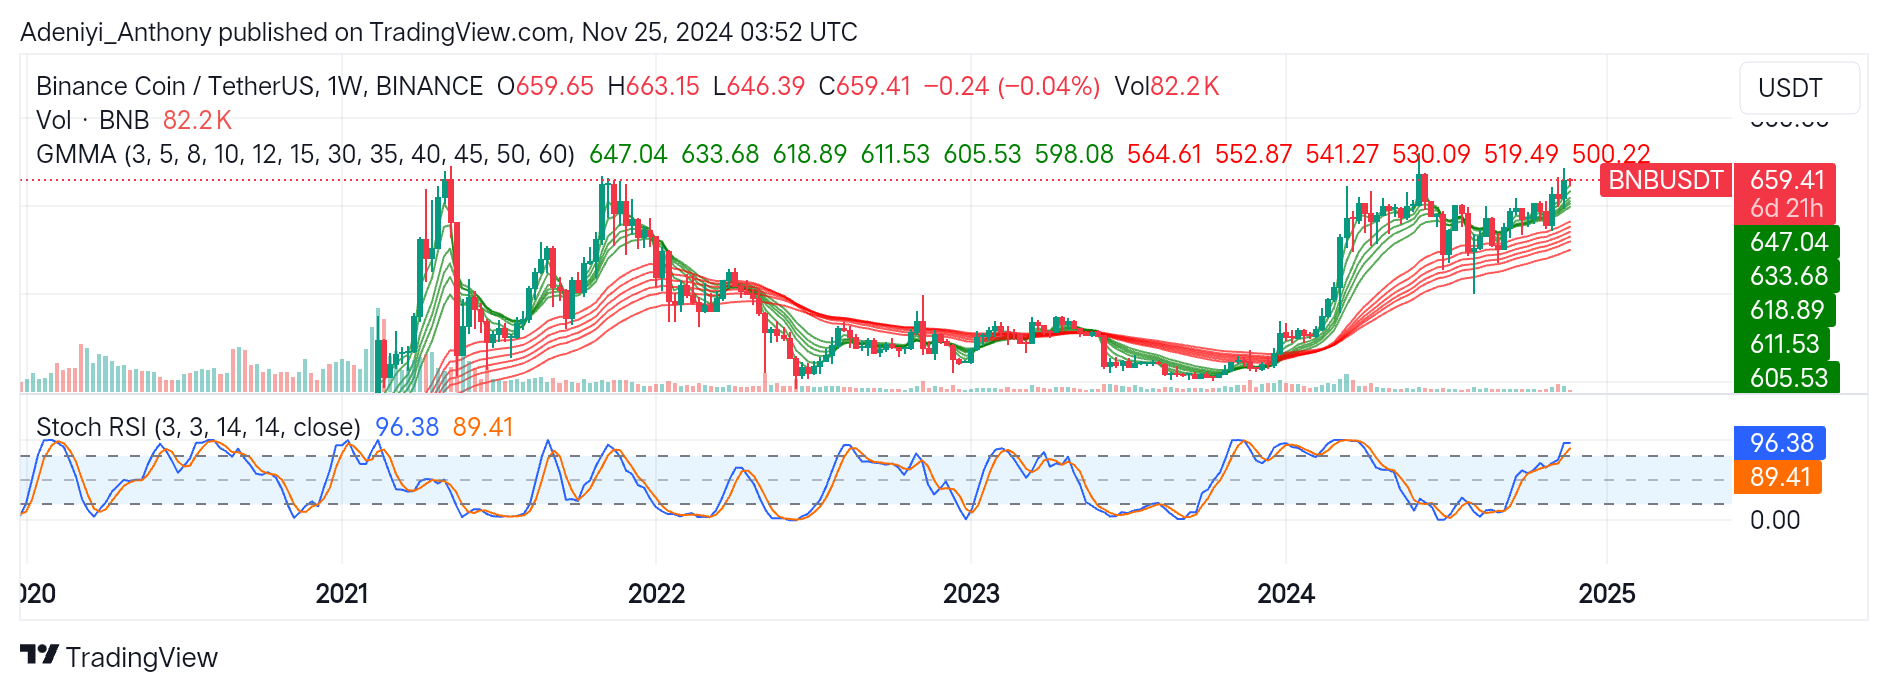
BNB has demonstrated remarkable strength against the Tether in recent weeks. The chart below reveals the uptrend as the pair trades above the Guppy Multiple Moving Averages (GMMA), suggesting a breakout from a consolidation phase. Though the market appears bullish, the oscillator at the bottom of the chart suggests caution due to an overbought condition, which may lead to a take-profit action.
Recently, BNB has climbed steadily over the weeks, breaking above key resistance at $647. However, the current expansion of the GMMA signals buyer dominance with the possibility of breaking above the historical level of $700.
Currently, BNB/USDT trades at $659.51 with an 82,200-traded volume. With more trading activities to come, the pair’s promising stance seeks to break above $700.
Technical Indicators
Major Resistance Levels: $660, $700, and $750
Major Support Levels: $647.04, $633.68, and $605.53
BNB Technical Analysis
BNB on a weekly timeframe is slightly down by 0.04% with a moderate volume of 82,200 traded volume. However, the GMMA signals a robust bullish trend ahead, as the two sets of exponential moving averages are expanding upward. This separation indicates strong buying pressure.
On the other hand, the Stochastic RSI is currently at 96.38 and 89.41, respectively. The indicator suggests heightened buying interest but indicates a pause or dip in price may strike the market soon.
In the short term, traders may see the price cooling off at $647.02 before further gains, while in the longer term, traders may see the pair breaking above the $700 level mark if the BNB/USDT successfully advances past $660.
However, caution is advised, as some take-profit activities may happen at the current peak.
BNB/USDT Analysis: A Continued Uptrend or a Sideways Movement?
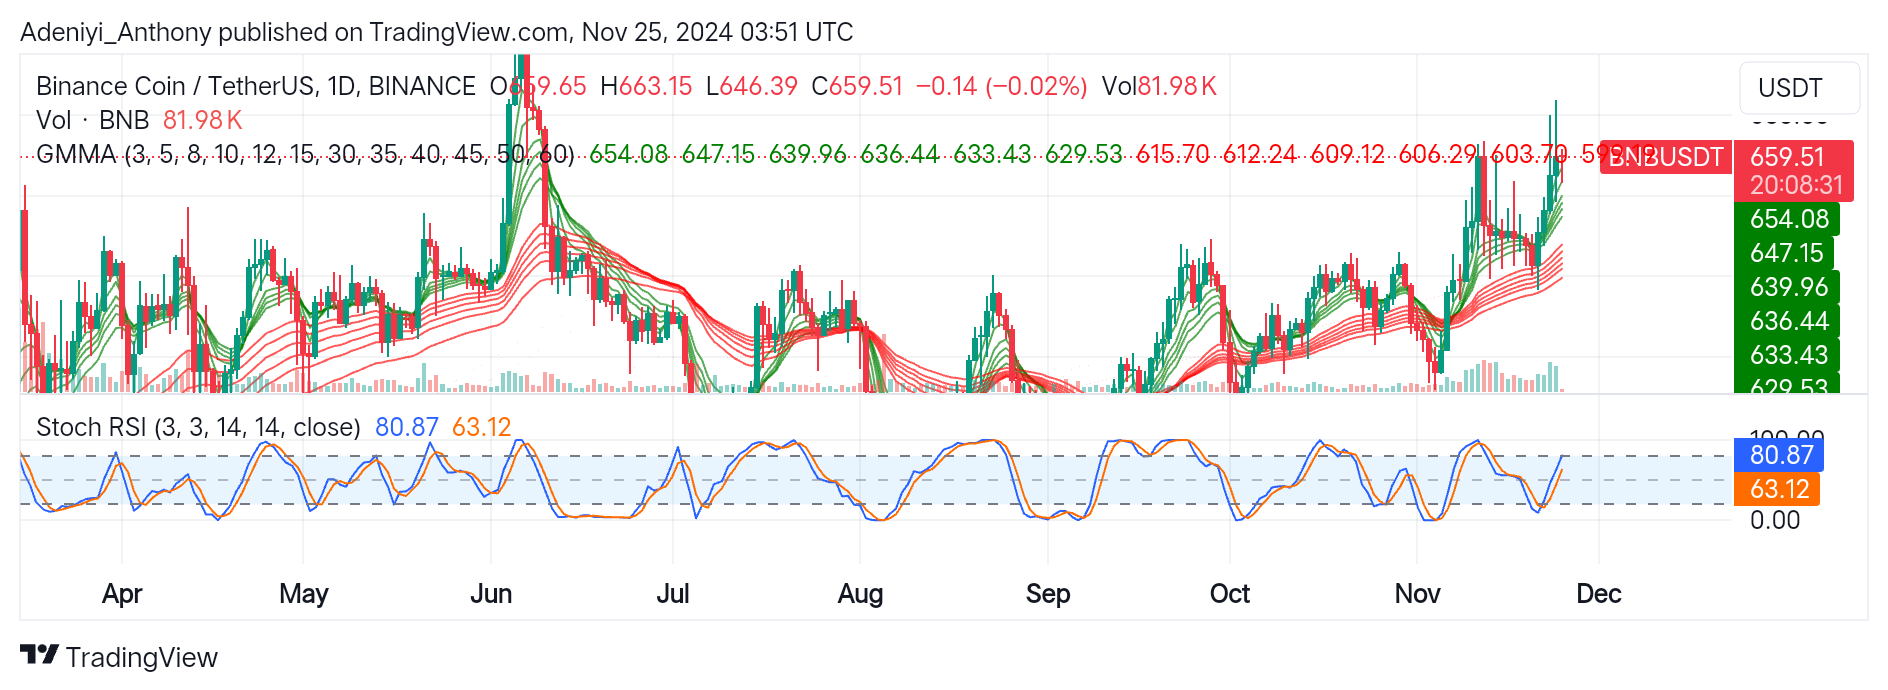
BNB against the USDT on the daily chart is experiencing bullish momentum, as seen in the formation of the higher highs and lows. The pair’s price seems to be ticking slightly downward as a result of a lack of market participants. However, the positioning of the GMMA and the Stochastic oscillator signal an uptrend in the near term.
With the price at $659.51, if the current condition persists, the pair may need to test the $647.15 before advancing to the North. Contrarily, the price seems to be struggling to break above the $660, but a successful attempt above this level could trigger a move towards the $700 level.
You can purchase crypto coins here. Buy LBlock