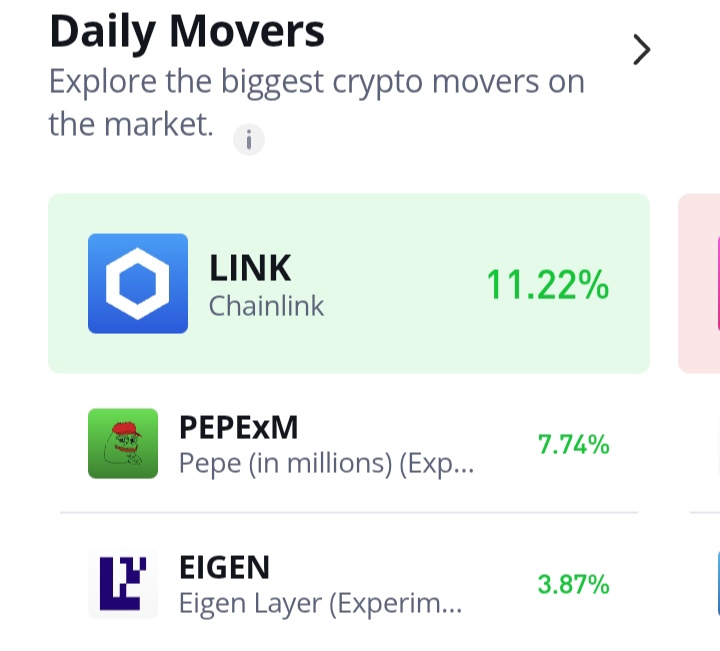
Chainlink (LINK/USD) Rebounds from $12 – Is This the Start of a Bullish Reversal?
Estimated Reading Time: 3 minutes
Don’t invest unless you’re prepared to lose all the money you invest. This is a high-risk investment and you are unlikely to be protected if something goes wrong. Take 2 minutes to learn more
In February, bullish support emerged at the $17 price level after a prolonged bearish trend. As buying interest gathered, the market consolidated for most of the month. However, the bears eventually regained control, driving the price lower in search of new support levels.
Currently, the market is experiencing a significant rebound, with prices rallying toward the critical $15.00 resistance level. The key question now is whether the bulls can overcome the prevailing bearish sentiment at this crucial point.
Chainlink Market Data
- LINK/USD Price Now: $13.89
- LINK/USD Market Cap: $9.6 billion
- LINK/USD Circulating Supply: 657 million LINK
- LINK/USD Total Supply: 1 billion LINK
- LINK/USD CoinMarketCap Ranking: #12

Key Levels
- Resistance: $14.00, $15.00, and $16.00
- Support: $12.00, $11.00, and $10.00
Chainlink Through the Lens of Indicators
From an indicator-based perspective, despite a clear pivot in price action, the market remains in bearish territory. Chainlink traders began buying around the $12.00 level, leading to a significant rally toward the critical $15.00 resistance. However, key technical indicators suggest caution.
The crypto signal remains below the 20-day moving average, and the Relative Strength Index (RSI) is still below the 50 level, signaling that bearish sentiment persists. Notably, the 20-day moving average has aligned with the $15.00 resistance level, making it a crucial test for the ongoing bullish recovery.
Judging by the trade volume histogram accompanying today’s price action, there is a strong possibility that the rally could face rejection at the $15.00 level unless bulls gain enough momentum to break and sustain above it.

LINK/USD Price Prediction: 4-Hour Chart Analysis
Analyzing the Chainlink market on the 4-hour chart with the Bollinger Bands indicator, the price action has surged beyond the upper band, signaling overbought conditions. Additionally, the price is already correcting downward, indicating that bearish pressure at the $15.00 resistance level is holding.
If the bulls fail to break this key resistance, it could suggest that they lack the strength to drive a sustained market reversal. In this case, price action may enter a consolidation phase until the market establishes a clear directional bias.