Stellar (XLM/USD) Attempts a Rebound at Higher Support – Can It Hold?
Estimated Reading Time: 3 minutes
Don’t invest unless you’re prepared to lose all the money you invest. This is a high-risk investment and you are unlikely to be protected if something goes wrong. Take 2 minutes to learn more

Following the market’s peak late last year, Stellar has been on a downward trend. The bearish price action has been prolonged, partly due to the presence of bullish activity attempting to counter the decline. The key support level that fueled the strong upward momentum late last year was $0.0734, from which the price surged to a high of $0.50—a remarkable gain. However, after peaking at this level on November 24, the market entered a bearish phase. Despite traders maintaining a degree of optimism, leading to multiple rebound attempts, the market has continued to form lower highs.
Stellar Market Data
- XLM/USD Price Now: $0.26
- XLM/USD Market Cap: $7.8 billion
- XLM/USD Circulating Supply: 26 billion XLM
- XLM/USD Total Supply: 50 billion XLM
- XLM/USD CoinMarketCap Ranking: #25
Key Levels
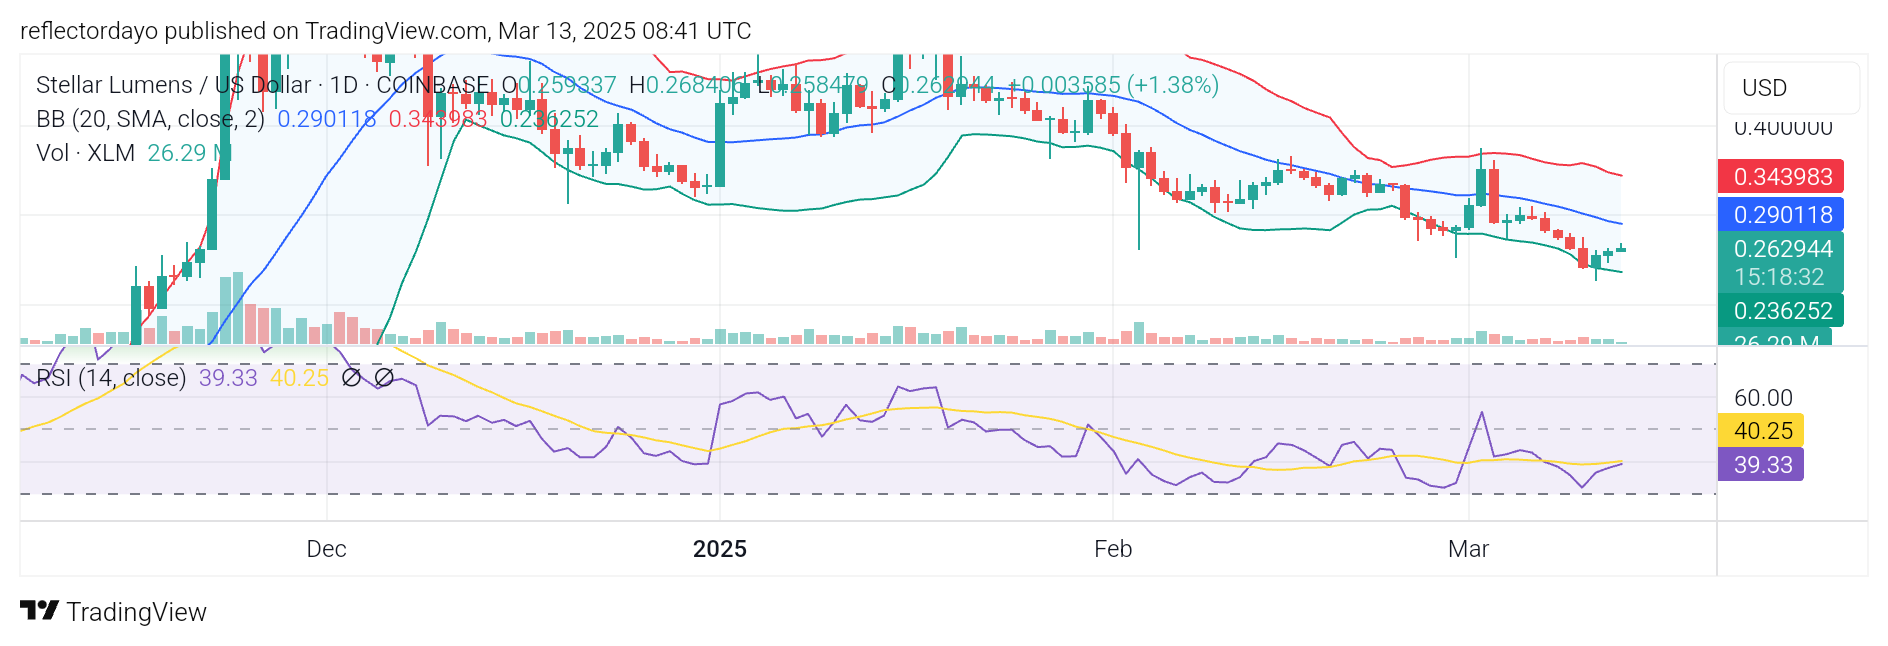
- Resistance: $0.35, $0.40, and $0.45
- Support: 0.24, $0.20, and $0.15
Stellar Through the Lens of Indicators
The market’s peaks continue to decline, with the most recent lower high forming at the $0.36 level. Currently, the price of Stellar is experiencing a moderate rally, but the weakening momentum suggests that the bulls may lack the strength to sustain a full recovery. Additionally, with the price still trading below the 20-day moving average, the likelihood of a bullish push toward the nearest resistance level remains uncertain. Technical indicators, including the Bollinger Bands and the Relative Strength Index (RSI), confirm that the market is still in bearish territory, giving the bears the upper hand for now.
XLM/USD Price Prediction: 4-Hour Chart Analysis
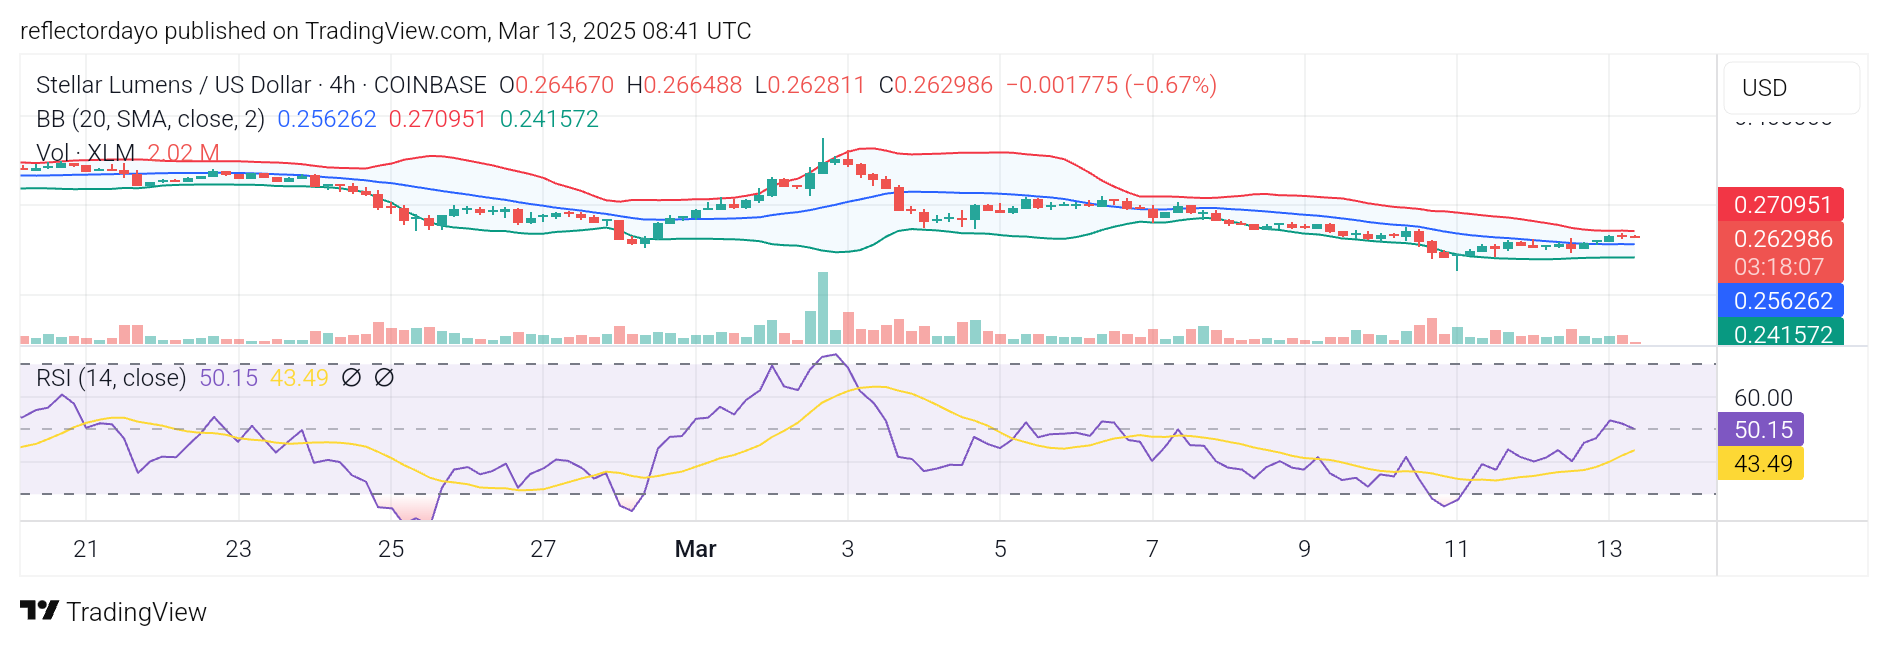
In the 4-hour chart, the market appears to have started a bullish rally but lost momentum quickly after encountering early resistance. While the initial target was the $0.36 level, bears have already pushed back at $0.265, signaling potential for further downside movement. As bulls and bears battle for control at this level, the outcome of this standoff will determine the market’s next direction. However, given the series of lower lows since late last year, the bears seem to have the upper hand, increasing the likelihood of a deeper decline. The price could be heading toward the starting point of the last bull run at $0.0734, or possibly finding support around the $0.10 level.