Chainlink (LINK) Declines and Reaches Previous Low above $15.04
Estimated Reading Time: 2 minutes
Don’t invest unless you’re prepared to lose all the money you invest. This is a high-risk investment and you are unlikely to be protected if something goes wrong. Take 2 minutes to learn more
Chainlink (LINK) Long-Term Analysis: Bearish
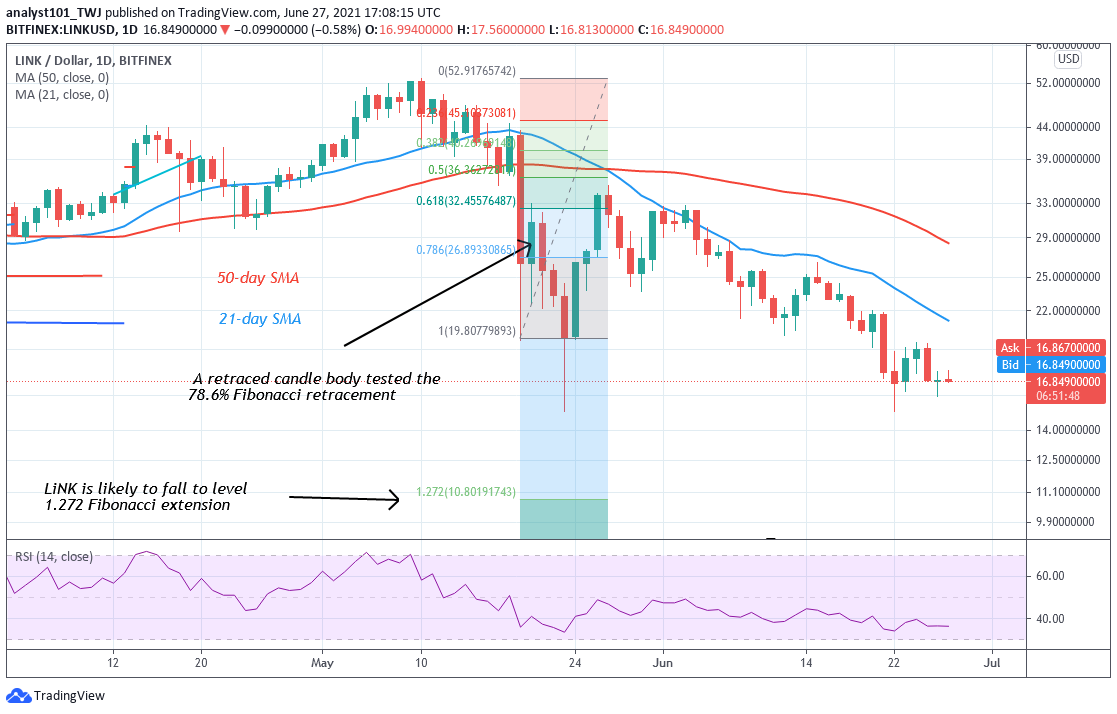
Chainlink (LINK) has fallen and it is trading at $16.87 at the time of writing. The market is declining as it revisits the previous low at $15.04. There is a tendency for price to continue falling on the downside if it breaks below the previous low. Meanwhile, on May 19 downtrend; a retraced candle body tested 78.6 % Fibonacci retracement level. The retracement indicates that coin will fall to level 1.272 Fibonacci extension and reverse. That is at level $10.80
Chainlink (LINK) Indicator Analysis
LINK has fallen to level 36 of the Relative Strength Index period 14. Chainlink will be in the oversold region if price falls below level 30. Presently, it indicates that it is in the downtrend zone and it is capable of falling on the downside. The 21-day SMA and 50-day SMA are sloping southward indicating the downtrend.

Technical indicators:
Major Resistance Levels – $60, $62, $ 64
Major Support Levels – $30, $28, $26
.
What Is the Next Direction for Chainlink (LINK)?
The current downtrend was caused by the rejection at the $19 high. The market has earlier been falling from the $26 high. Meanwhile, on June 22 downtrend; a retraced candle body tested 78.6 % Fibonacci retracement level. The retracement indicates that coin will fall to level 1.272 Fibonacci extension and reverse. That is at level $11.98.

You can purchase crypto coins here. Buy Tokens
Note: new.cryptosignals.org is not a financial advisor. Do your research before investing your funds in any financial asset or presented product or event. We are not responsible for your investing result