Litecoin (LTC) Price Prediction: LTC/USDT Yet to Escape Gravitational Pull
Estimated Reading Time: 2 minutes
Don’t invest unless you’re prepared to lose all the money you invest. This is a high-risk investment and you are unlikely to be protected if something goes wrong. Take 2 minutes to learn more

Date: December 30, 2025
Litecoin has continued to trade near lower price levels, while overall price action remains weighed down by bearish sentiment. Although price movement on the daily chart is still holding above some key technical levels, downward forces remain firmly in control of the market.
LTC/USDT Long-Term Trend — Bearish (Daily Chart)
Key Price Levels
Resistance: $80, $85, $90
Support: $75, $70, $65
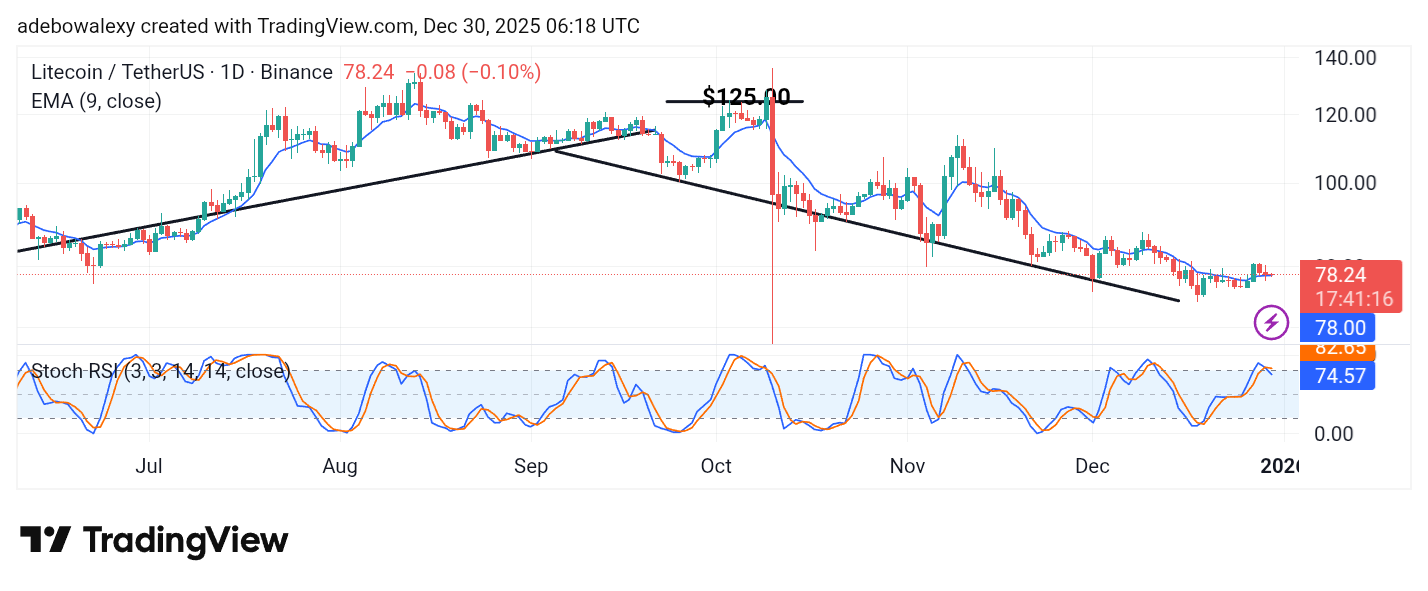
Price activity in the Litecoin 24-hour market is trending toward lower price levels. The price candle corresponding to the current session is red. However, this candle appears noticeably smaller, allowing price to remain slightly above the 9-day Exponential Moving Average (EMA) line. Meanwhile, the Stochastic Relative Strength Index (SRSI) indicator lines have just delivered a downward crossover. The terminal ends of the indicator lines are dropping through the 80 level and may continue moving lower.
Litecoin (LTC) Price Prediction: LTC/USDT Tests a Key Baseline
On the LTC daily chart, price action has been gradually declining over the past two sessions. Despite this, bearish momentum appears to have weakened slightly during the same period.
The most recent price candle is red with a relatively small body, as price tested the 9-day EMA curve. At the same time, the SRSI indicator lines have completed a downward crossover, with the terminal points of the indicator sliding toward lower thresholds. At this stage, it appears that bears may still retain control of the market.
Litecoin (LTC) Price Prediction: LTC/USDT Continues to Struggle (4-Hour Chart)
Even on the 4-hour chart, price action has remained unable to break above a key resistance level. The most recent price candle on this timeframe is green but heavily compressed, with a clear upper shadow.
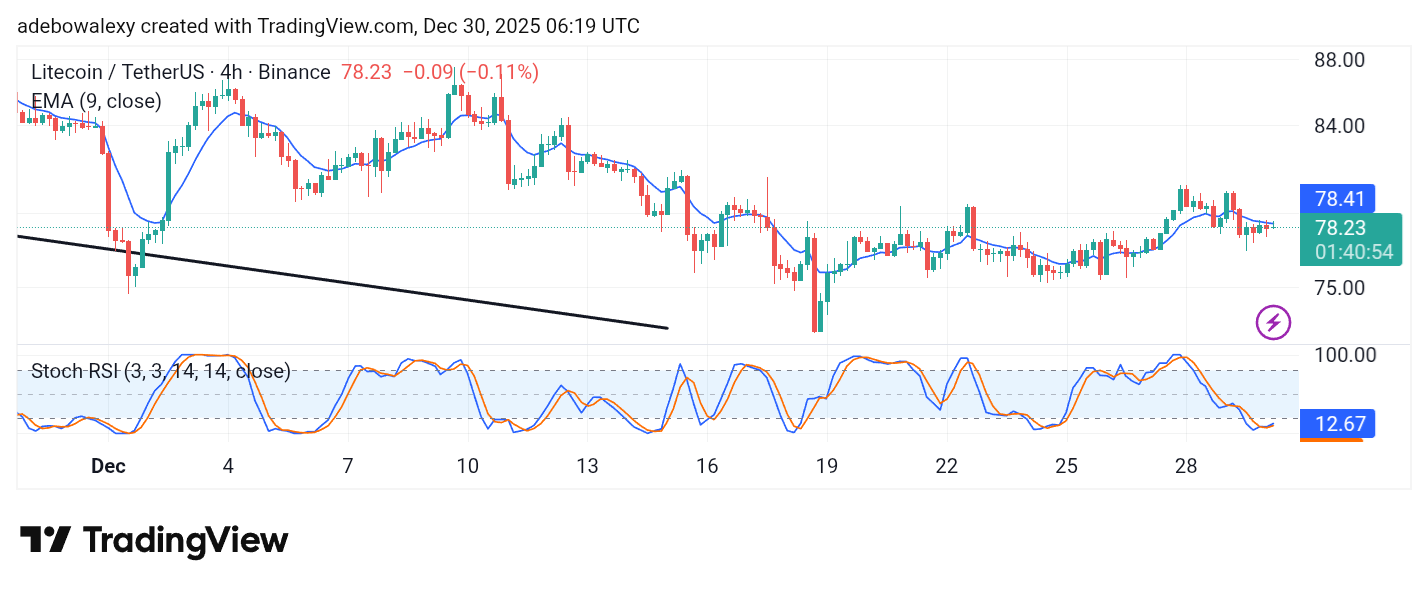
Meanwhile, the SRSI indicator lines are turning upward from their position in the oversold region of the indicator. Nevertheless, price action remains capped below the 9-day EMA curve. As a result, this market still appears vulnerable to further downside, with prices potentially drifting toward the $75 level.