Litecoin (LTC) Price Prediction: LTC/USDT Keeps a Trajectory Toward the $70 Threshold
Estimated Reading Time: 3 minutes
Don’t invest unless you’re prepared to lose all the money you invest. This is a high-risk investment and you are unlikely to be protected if something goes wrong. Take 2 minutes to learn more

Date: December 23, 2025
Price movement on the Litecoin daily chart remains below key technical levels. Although the ongoing session is hovering near an important technical resistance, headwinds appear to remain dominant in this market. This may keep prices trending downward.
LTC/USDT Long-Term Trend — Bearish (Daily Chart)
Key Price Levels
Resistance: $80, $85, $90
Support: $75, $70, $65
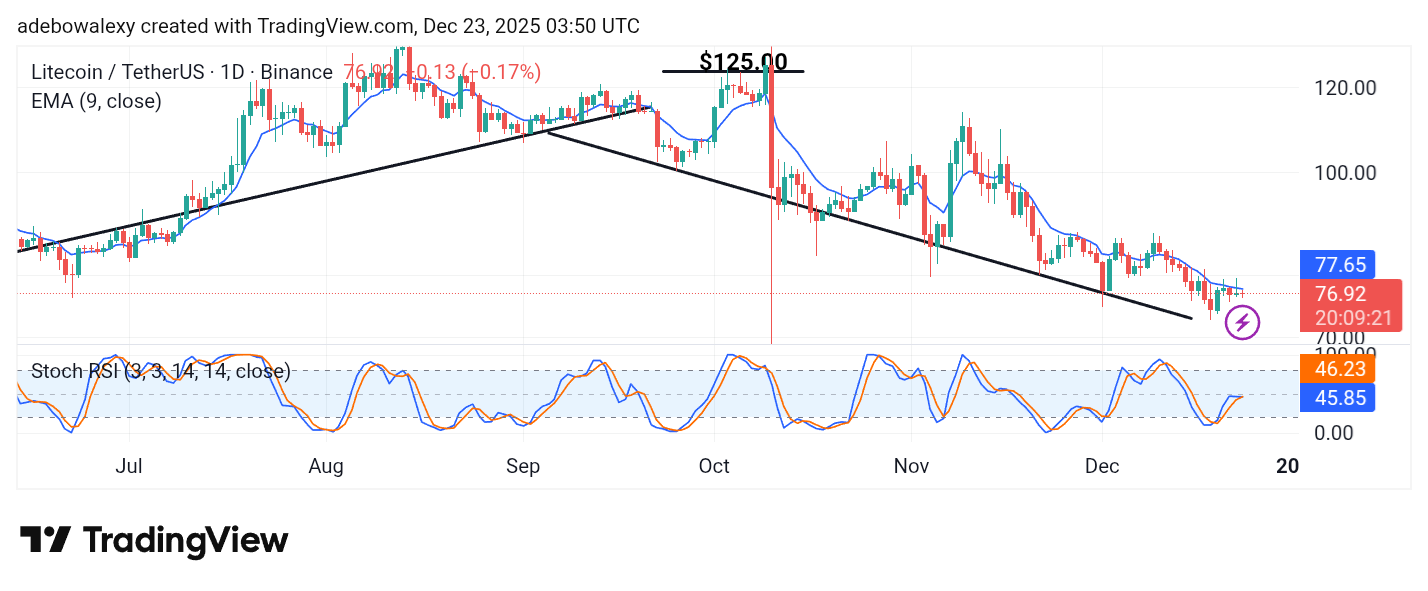
On the Litecoin daily chart, the ongoing session is represented by a red spinning-top price candle. It has appeared just below the 9-day Exponential Moving Average (EMA) line. Simultaneously, the Stochastic Relative Strength Index (SRSI) indicator lines have delivered a crossover just below the 50 threshold. Nevertheless, the lines seem to retain a slight upward bias.
Litecoin (LTC) Price Prediction: LTC/USDT Tries to Stabilize Above the $75 Mark
For about three consecutive sessions, the Litecoin market appears to have moved in a sideways trajectory, with prices remaining largely stagnant. However, this action is occurring below the 9-day EMA curve, which technically suggests that headwinds may have the upper hand.
Likewise, the SRSI indicator lines have produced a downward crossover just below the 50 mark, but the ensuing lines are not declining as sharply as expected on the daily chart—possibly due to the ongoing market tussle. Overall, headwinds are tipped to remain in control.
Litecoin (LTC) Price Prediction: LTC/USDT Holds a Bearish Outlook (4-Hour Chart)
The Litecoin 4-hour chart confirms that bears are maintaining a firm grip on the market. The latest price candle is red and has formed a hammer pattern.
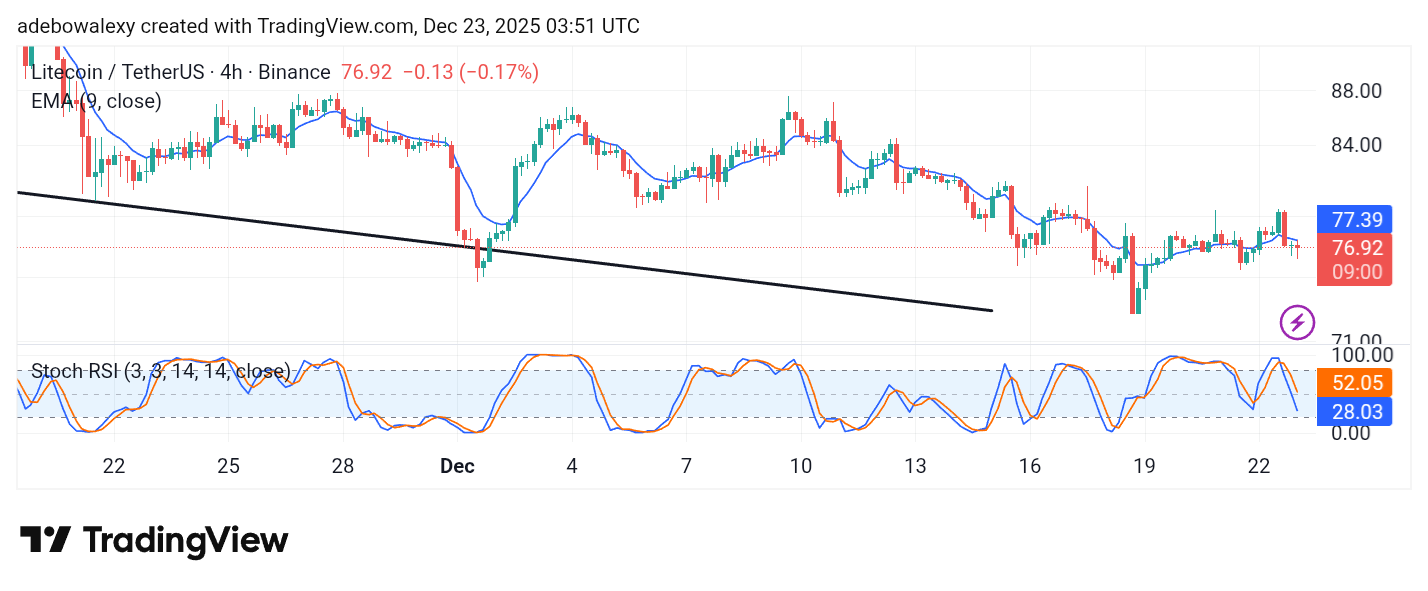
It has also appeared below the 9-day EMA curve, reinforcing the impression of bearish dominance. Furthermore, unlike the SRSI indicator behavior on the daily chart, the SRSI lines on the 4-hour chart are declining more rapidly, largely due to the dip recorded over the past two sessions. Consequently, the downward retracement may extend toward the $75 price level.
Get Litecoin (LTC) here. Buy LTC https://partner.bybit.com/b/cryptosignalstrading
Litecoin (LTC) Price Prediction: LTC/USDT Keeps Falling to Lower Support