Orchid (OXT/USD) Bulls Found a Higher Support Level
Estimated Reading Time: 3 minutes
Don’t invest unless you’re prepared to lose all the money you invest. This is a high-risk investment and you are unlikely to be protected if something goes wrong. Take 2 minutes to learn more
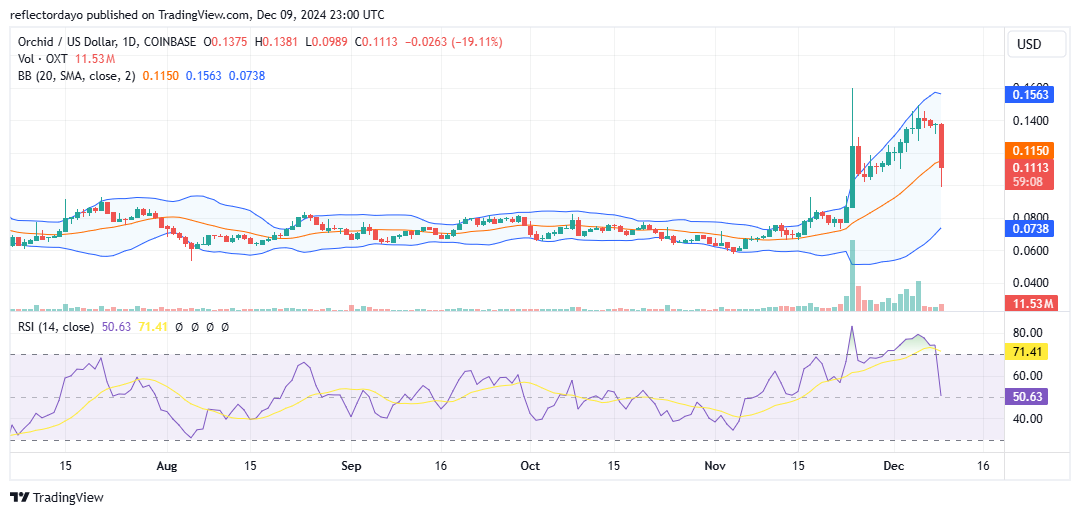
The Orchid market has been trading within a stable price range, moving sideways around the $0.07 level for some time. However, in the second half of November, market dynamics shifted as crypto signal action gained momentum, surging past the $0.08 level. This breakout attracted significant bullish interest, propelling the price to a remarkable peak of $0.16.
This rapid upward movement, however, heightened market volatility, prompting a strong bearish response. The subsequent bearish correction brought the price down to establish a new support level at $0.10. At this point, renewed buying activity among traders suggests a potential stabilization or recovery in the market.
Orchid Market Data
- OXT/USD Price Now: $0.1107
- OXT/USD Market Cap: $108 million
- OXT/USD Circulating Supply: 979 million OXT
- OXT/USD Total Supply: 1 billion OXT
- OXT/USD CoinMarketCap Ranking: #469
Key Levels
- Resistance: $0.15, $0.16, and $0.17
- Support: $0.10, $0.09, and $0.08.
The Orchid Through the Lens of Indicators
A strong bullish move, such as the one observed, often triggers a bearish price correction. On November 25th, the trading volume surged dramatically, as indicated by a prominent histogram, signaling a significant explosion in bullish momentum. However, profit-taking was quickly triggered at the $0.16 level, leading to a sharp correction.
The strength of this correction suggested the possibility of a return to the $0.08 level, potentially converting it from a previous resistance into a support level. However, a higher support level emerged at the critical $0.10 mark. Traders began buying at this level, driving the price upward, though bears re-entered the market at a lower resistance level, capping the recovery.
In today’s trading session, the price once again bounced off the $0.10 support level, reinforcing its significance as a key level of strength for the Orchid market.
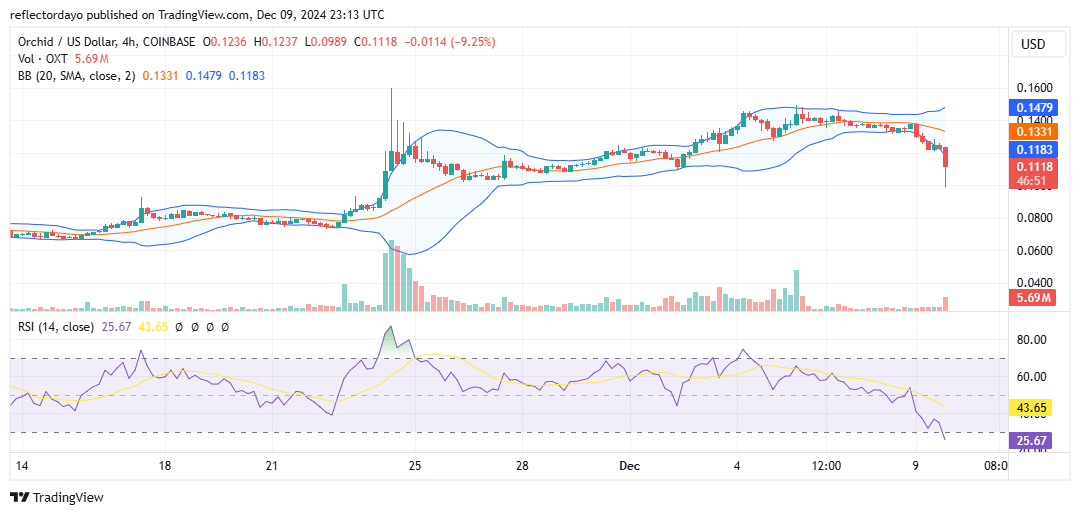
OXT/USD Price Prediction: 4-Hour Chart Analysis
Analyzing the market indicators on the 4-hour price chart suggests a potential rebound is imminent. The RSI has dipped below the 30 level, signaling an oversold condition. Additionally, the price action has fallen below the lower band of the Bollinger Bands, further confirming the oversold state and hinting at a likely correction.
Notably, the price is already showing signs of recovery, moving upward from its recent lows. This development may present an opportune moment to consider a long position, as the market appears poised for a reversal.