Uniswap (UNI) Price Prediction: UNI/USDT Reapproaches $10.00
Estimated Reading Time: 3 minutes
Don’t invest unless you’re prepared to lose all the money you invest. This is a high-risk investment and you are unlikely to be protected if something goes wrong. Take 2 minutes to learn more

Date: August 7, 2025
The Uniswap market recently traded well above the $10.00 price level. However, it soon retreated below that mark. Albeit, the token now appears to be making its way toward breaching that psychological resistance once more.
UNI/USDT Long-Term Trend — Bullish (Daily Chart)
Key Price Levels:
Resistance: $10.00, $11.00, $12.00
Support: $9.00, $8.50, $8.00
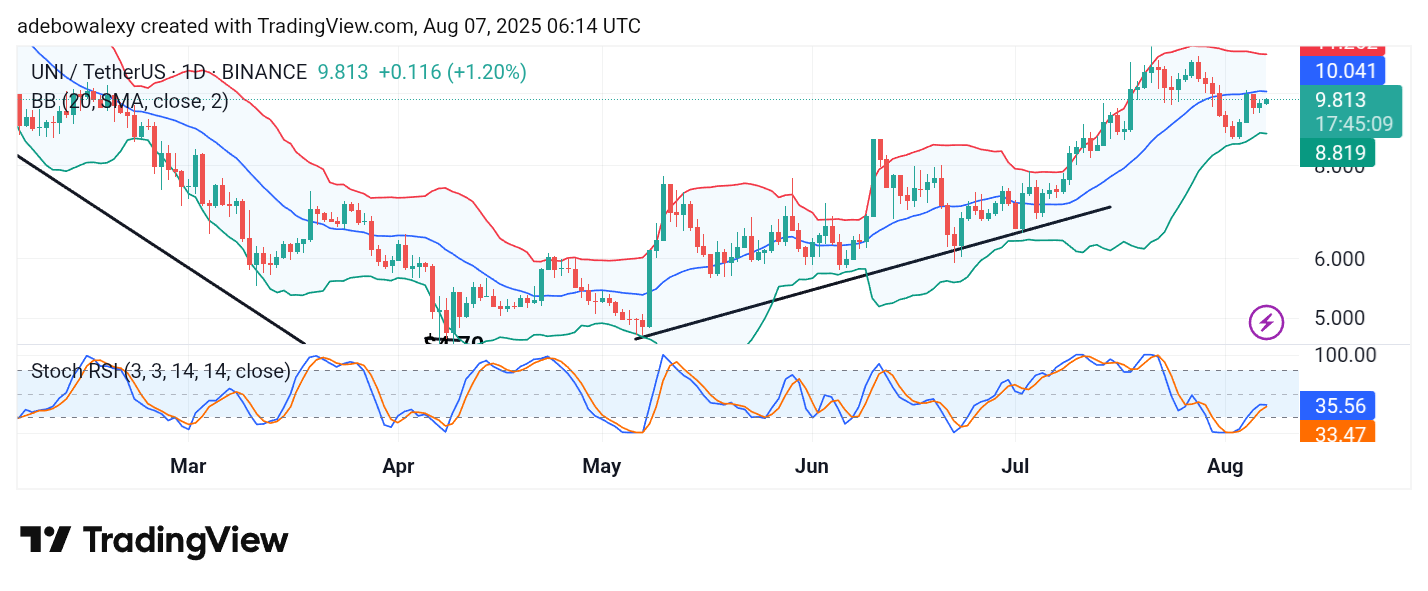
The ongoing session in the Uniswap daily market remains in the green. The last price candle on the chart appears green but remains below the middle band of the Bollinger Bands (BB) indicator. While the market has experienced some volatile swings, the general price movement maintains an upward trajectory.
The last two price candles on this chart are green but relatively small, and as a result, the Stochastic Relative Strength Index (SRSI) indicator lines continue to trend upward. However, the ends of the SRSI lines appear to be converging, possibly hinting at a downward crossover.
Uniswap Price Prediction: UNI/USDT Market Faces Resistance Ahead
With Uniswap price action still below the middle band of the Bollinger Bands (BB) indicator, upward movement in the Uniswap market continues to face resistance. However, the BB indicator has a slight upward slope, suggesting that bullish forces are still present. The SRSI indicator lines are pointed upward but appear to be converging toward a crossover. Nonetheless, considering that price action has been moving upward since the previous session, it suggests that bullish momentum may persist and could lead to further gains.
Uniswap Price Prediction: UNI/USDT May Breach the $10.00 Resistance (4-Hour Chart)
Price action in the Uniswap 4-hour chart hints at a significant, albeit short-term, upward movement.
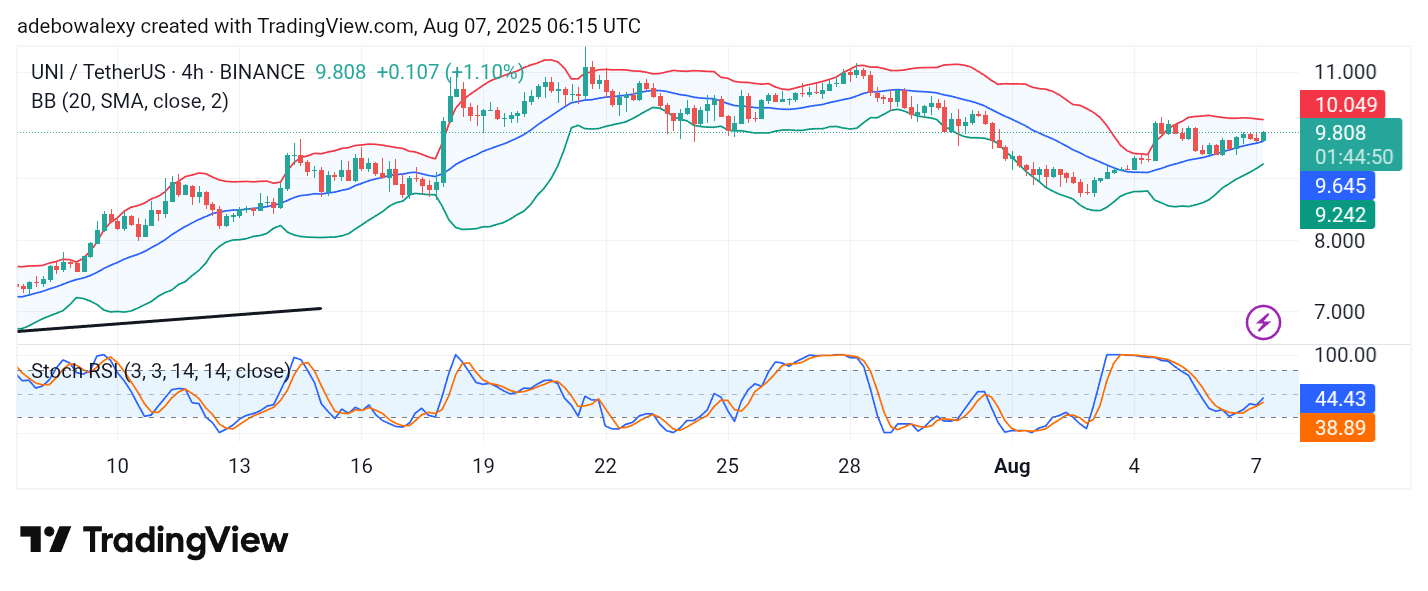
The most recent price candle is green and positioned directly on the middle band of the BB indicator. Additionally, the BB indicator itself is tilted upward, reflecting a bullish market sentiment.
Meanwhile, the SRSI indicator lines have reversed from a previous bearish direction and are now trending upward. Technically, this supports the outlook that the market is poised to breach the $10.00 resistance and potentially head toward the $10.50 level.