Sponge/USD ($SPONGE) to Rebounds Strongly from $0.000092
Estimated Reading Time: 3 minutes
Don’t invest unless you’re prepared to lose all the money you invest. This is a high-risk investment and you are unlikely to be protected if something goes wrong. Take 2 minutes to learn more
The SPONGE/USD market has encountered persistent bearish pressures, causing it to decline towards the $0.00009 threshold. Despite an extended period of price fluctuations around $0.0000988, in close proximity to the significant $0.00010 level, the resolute bearish sentiment has prompted numerous fluctuations, gradually bringing the market closer to the $0.00009 threshold. This juncture may represent a potential inflection point for a bullish resurgence, particularly as the market inclines towards the critical $0.00009 price level. However, an intriguing development is underway as the market appears to pivot around the $0.000092 mark.
Key Price Levels
- Resistance: $0.000115, $0.000120, and $0.000125.
- Support: $0.000090, $0.000080, and $0.000085.
Sponge (SPONGE/USD) Price Analysis: Technical Insights
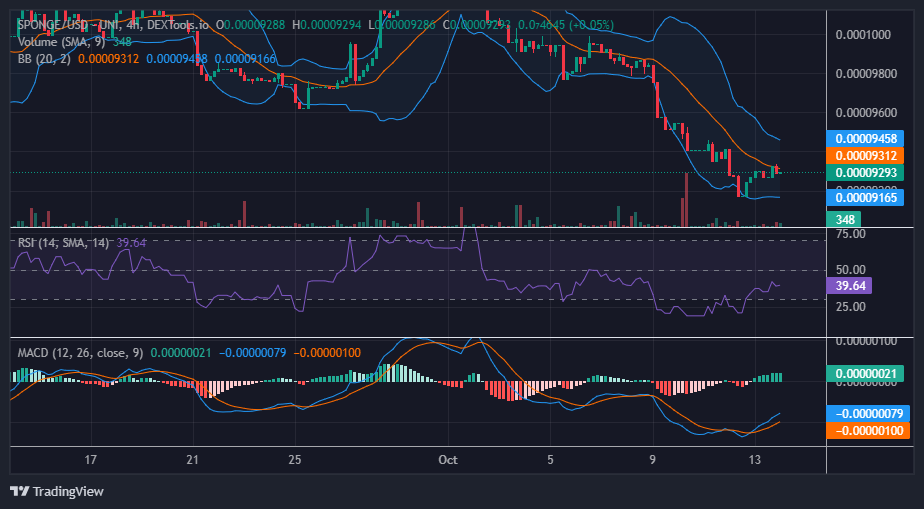
The SPONGE/USD market, in its present state, appears to be positioned for a potential rebound, with the bullish price recovery bringing the market to approximately $0.000093. However, the bear market’s resilience persists, although bullish forces are making headway against prevailing resistance levels. Nevertheless, there is a glimmer of optimism offered by the Relative Strength Index (RSI), indicating a potential weakening of bearish sentiment. The RSI’s upward movement, as it recovers from the sub-30 oversold threshold, suggests an increase in buying interest and the development of positive momentum. Currently, the bearish momentum in the market is diminishing.
Furthermore, the Moving Average Convergence and Divergence (MACD) indicator exhibits signs of a noteworthy recovery. Both MACD lines are retracing upward, on the verge of crossing into bullish territory, and the histograms show strong activity. This is interpreted as a bullish signal, signifying a potential conclusion to the recent downtrend and the initiation of a reversal.
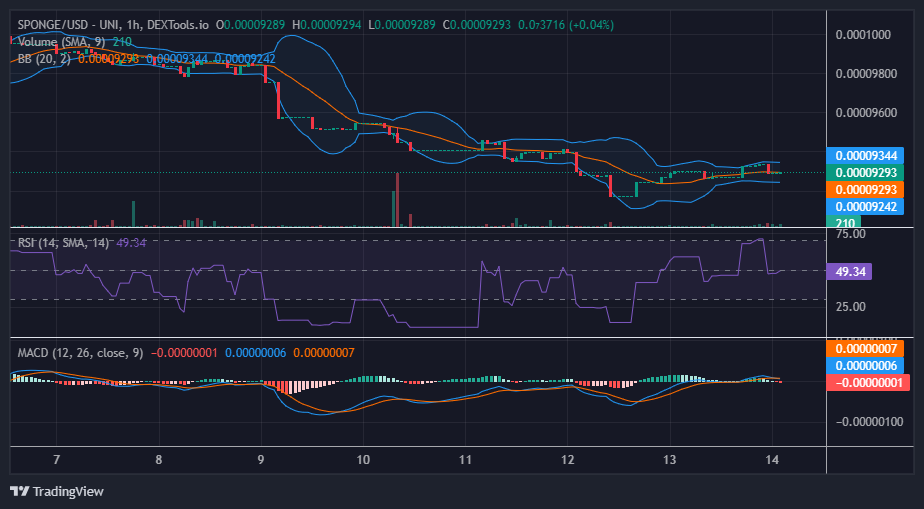
Short-Term Outlook: 1-Hour Chart
An analysis of the 1-hour chart highlights the market’s ongoing battle with several resistance levels. In the previous 1-hour chart analysis, the bull market exhibited strong momentum in an attempt to breach the $0.000093 resistance. However, as this attempt met with resistance and the price failed to break through, buyers are now regrouping at approximately $0.00009289, with their sights still set on reclaiming the $0.00010 price level.
While the bullish price advance faced a temporary setback, it is worth noting that the Bollinger Bands continue to depict an upward-trending price channel. This suggests that the bull market remains actively engaged and competitive.
The first season of the Sponge airdrop is rapidly approaching!
🚨 The clock is ticking for Season 1 of the #SpongeCoin Airdrop! 🔥
Get your entries in before 30th of October, 2023! 🧽🌊
Learn how to enter below ⤵️https://t.co/lzRhjW4oLL#SPONGE #Web3 #Crypto #Alts pic.twitter.com/7jWUmUUOcR
— $SPONGE (@spongeoneth) October 14, 2023
Invest in the hottest and best meme coin. Buy Sponge ($SPONGE) today!