Solana (SOL) Price Prediction: SOL/USDT Bulls Lack Steam
Estimated Reading Time: 3 minutes
Don’t invest unless you’re prepared to lose all the money you invest. This is a high-risk investment and you are unlikely to be protected if something goes wrong. Take 2 minutes to learn more
Solana (SOL) Price Prediction December 13:
The Solana market has resulted in a lackluster performance above the $220 price level. More recently, the market seems to be making lower lows, which is bringing the market toward the baseline near the $200 baseline.
SOL/USDT Long-Term Trend: Bearish (Daily Chart)
Key Price Levels:
Resistance: $230, $240, $250
Support: $220, $210, $200
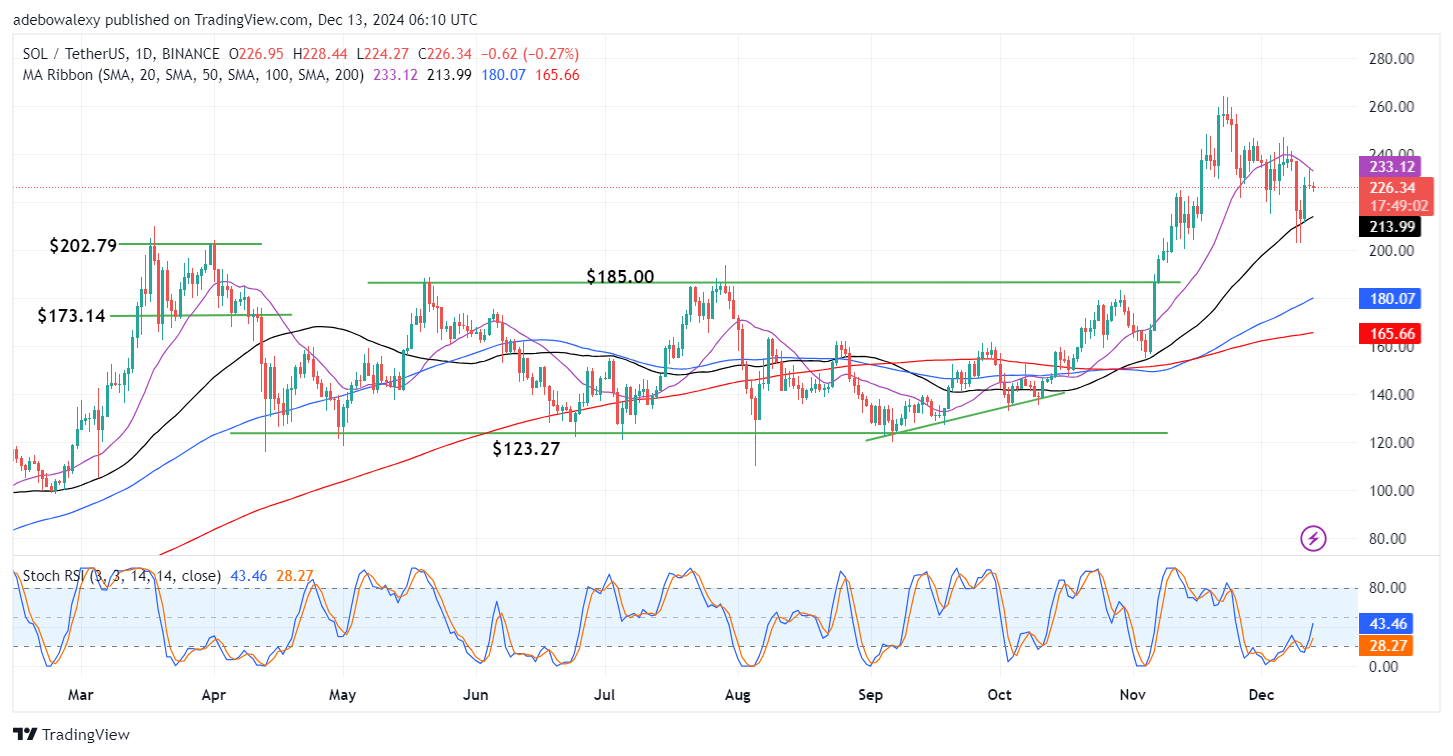
The last price candle can be seen appearing considerably above the $200 base level. The corresponding price candle to the previous session had tested the ceiling formed by the 20-day Moving Average (MA) lines. The last price candle has appeared bearish while descending a bit below the previous price candle. Yet, price action stays above most of the MA lines. The Stochastic RSI lines continue to rise upward from the oversold region. However, it should be noted that the last two price candles on the chart are quite small.
Solana (SOL) Price Prediction: Solana Price Declines Slightly
The Solana market witnessed a strong upside in the past two sessions. This occurred as price action tested the support formed by the 50-day MA line. This brought the market straight through the $220 price level. The following session was bearish as expected, but it could be seen that the bears weren’t making much progress, as it could be seen.
The Stochastic Relative Strength Index lines are still projected upward towards the overbought region of the indicator. However, it seems the indicator lines are still reflecting the price increase of the past two sessions. This seems largely because the market hasn’t seen a strong downward retracement since the previous session till now.
Solana (SOL) Price Prediction: SOL/USDT Eyes the Support at the $220 Support (4-Hour Chart)
Looking at the Solana market on the 4-hour market timeframe, it reveals that price action seems oriented towards the support at the $220 price level. The last price candle on the chart is a bearish one. It seems to have a much bigger body than recent price candles. Furthermore, it has appeared below three MA lines. What’s more, is that these MA lines are intersecting with each other. The Stochastic RSI lines can be seen descending through the 80 threshold.
Indications suggest that price action may decline lower. More recent price candles can be seen appearing below most of the MA lines on the chart. Also, the last price candle draws closer to the last MA curve, which is the 20-day MA line. However, the movement of the RSI indicator lines seems a bit too sensitive and as such suggests that the 20-day MA or the $220 price level might be a strong support for price action.