Uniswap (UNI) Price Prediction: UNI/USDT Resurfaces Above the $18.00 Price Level
Estimated Reading Time: 3 minutes
Don’t invest unless you’re prepared to lose all the money you invest. This is a high-risk investment and you are unlikely to be protected if something goes wrong. Take 2 minutes to learn more

Uniswap (UNI) Price Prediction December 12:
Buyers in the Uniswap daily market are quickly gaining traction. This started after upside forces were able to defend the technical support at the $14 threshold level during the fourth and third sessions. This has led to an impressive recovery, and more may be on the way.
UNI/USDT Long-Term Trend: Bearish (Daily Chart)
Key Price Levels:
Resistance: $100,000, $105,000, $110,000
Support: $95,000, $90,000, $85,000
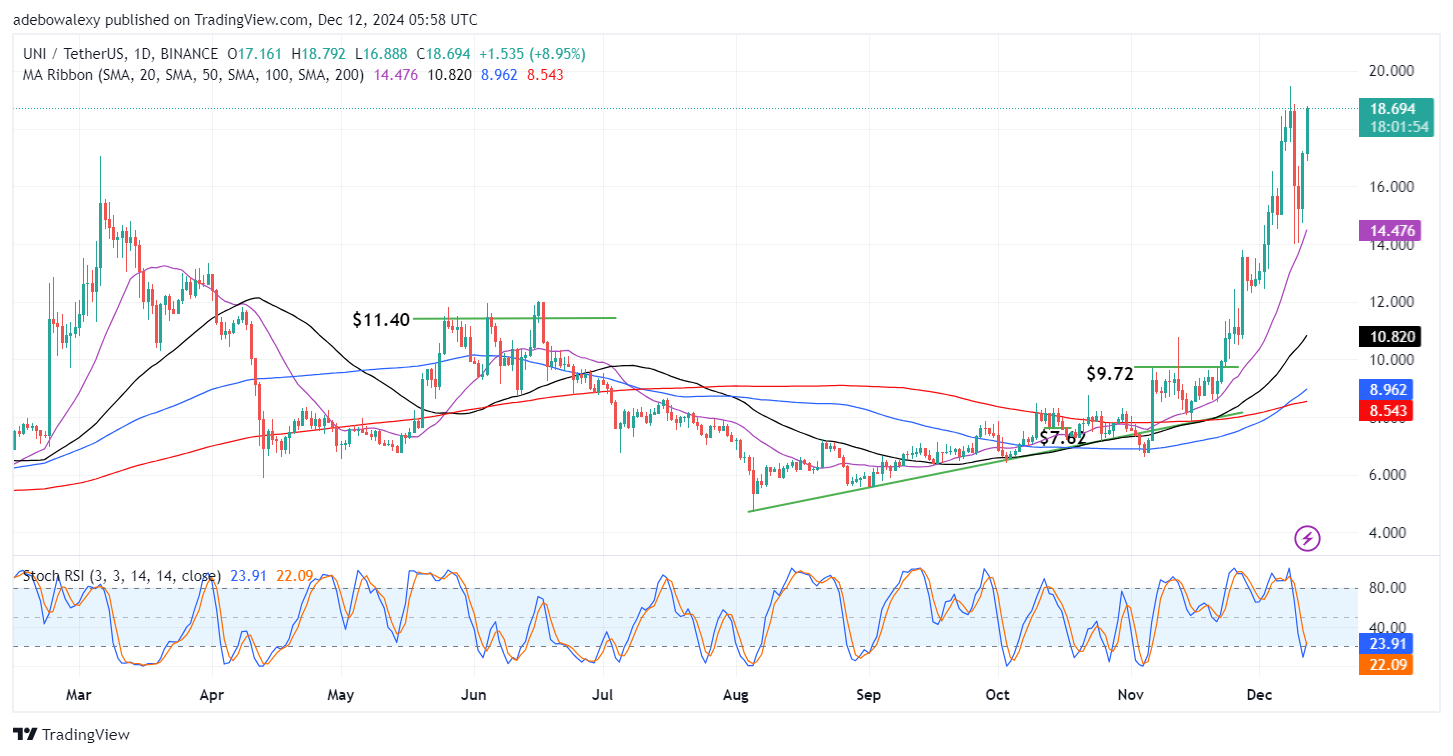
The price of the Uniswap token has been in the green for the second session, bringing the token to trade even above the $18.50 price level. As a result, price action continues to rise upward above all the Moving Average (MA) curves. Meanwhile, the Stochastic Relative Strength Index (RSI) lines are just at a crossover above the 20 threshold of the indicator. This is happening when the market has seen a considerable level of recovery.
Uniswap (UNI) Price Prediction: Uniswap Traders Seem Well-Poised for More Gains
Technical indicators are strongly biased to predict that upside forces are tipped to remain dominant. The last price candle on the chart has appeared bullish. Also, it has a small shadow, indicating that downward forces haven’t had much impact on buyers.
Likewise, the position of price action above all the MA lines shows that upside forces are staying ahead. The Stochastic RSI lines are still in the overbought region but are at a bullish crossover. Also, considering the movement of the Stochastic RSI lines and how well the market has progressed, it seems that we may see a strong price upswing in this market.
Uniswap (UNI) Price Prediction: UNI/USDT Bulls Stay Well-Grounded (4-Hour Chart)
Price action in the 4-hour Uniswap market stays under bullish influences. A new session has begun, and the market has continued to retrace higher ground. Price action now lies above all the MA lines. At the same time, the 20- and 50-day MA lines can be seen to have delivered a crossover below recently formed price candles. Meanwhile, the Stochastic RSI lines have reached the peak of the overbought region, and the lines of the indicator are now dragging at the 100 mark.
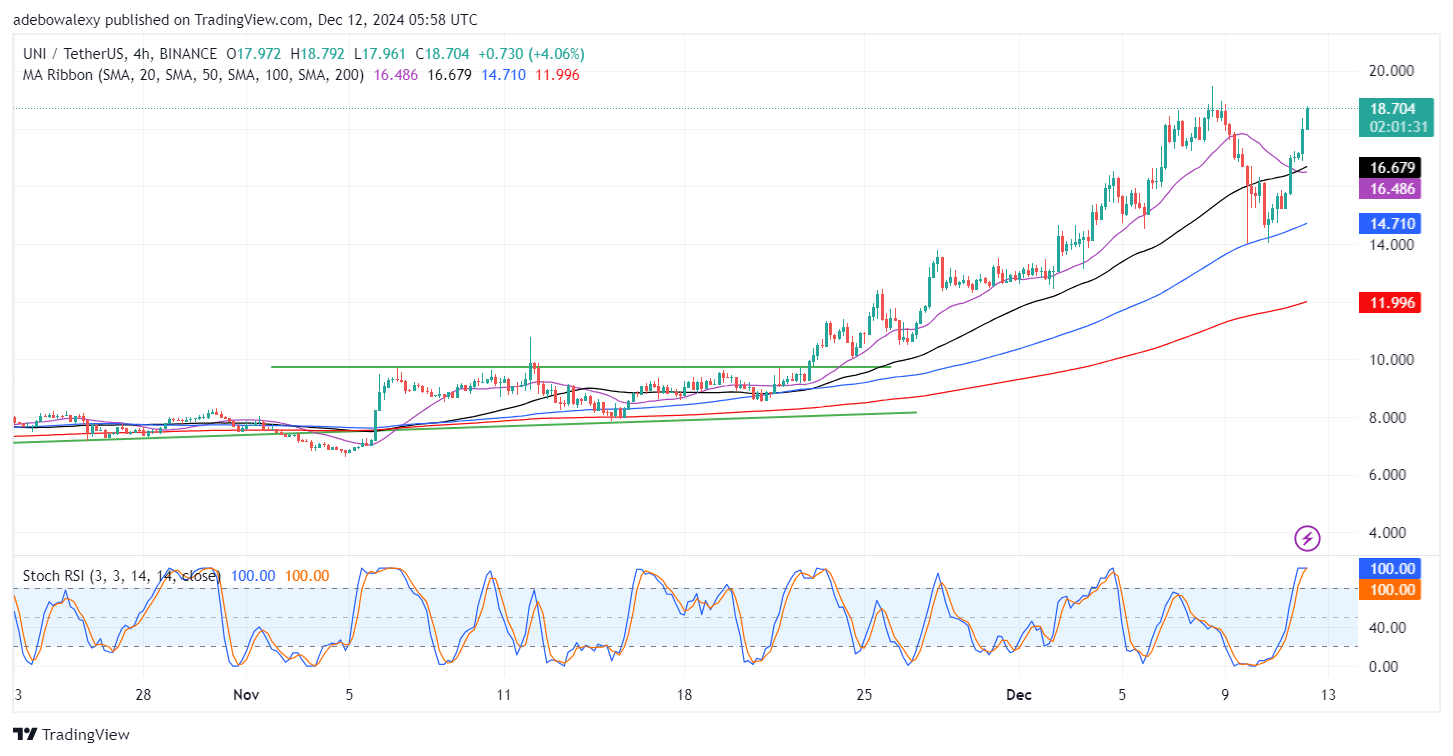
Technically, this market is well-positioned for more bullish activity considering the available indications on the chart. The delivered crossover below price action has supplied bulls with more steam. However, the Stochastic RSI has indicated a strong overbought condition. Nevertheless, this market seems to be targeting the $20 price level.