Bitcoin (BTC) Price Prediction: BTC/USDT Refocuses on the $100,000 Ceiling
Estimated Reading Time: 3 minutes
Don’t invest unless you’re prepared to lose all the money you invest. This is a high-risk investment and you are unlikely to be protected if something goes wrong. Take 2 minutes to learn more

Bitcoin (BTC) Price Prediction December 11:
The Bitcoin market has once more taken an upward trajectory after dipping below the $95,000 level over the past two sessions. The ongoing session, however, has refocused this market toward the $100,000 mark, which is a psychological resistance price level.
BTC/USDT Long-Term Trend: Bearish (Daily Chart)
Key Price Levels:
Resistance: $100,000, $105,000, $110,000
Support: $95,000, $90,000, $85,000
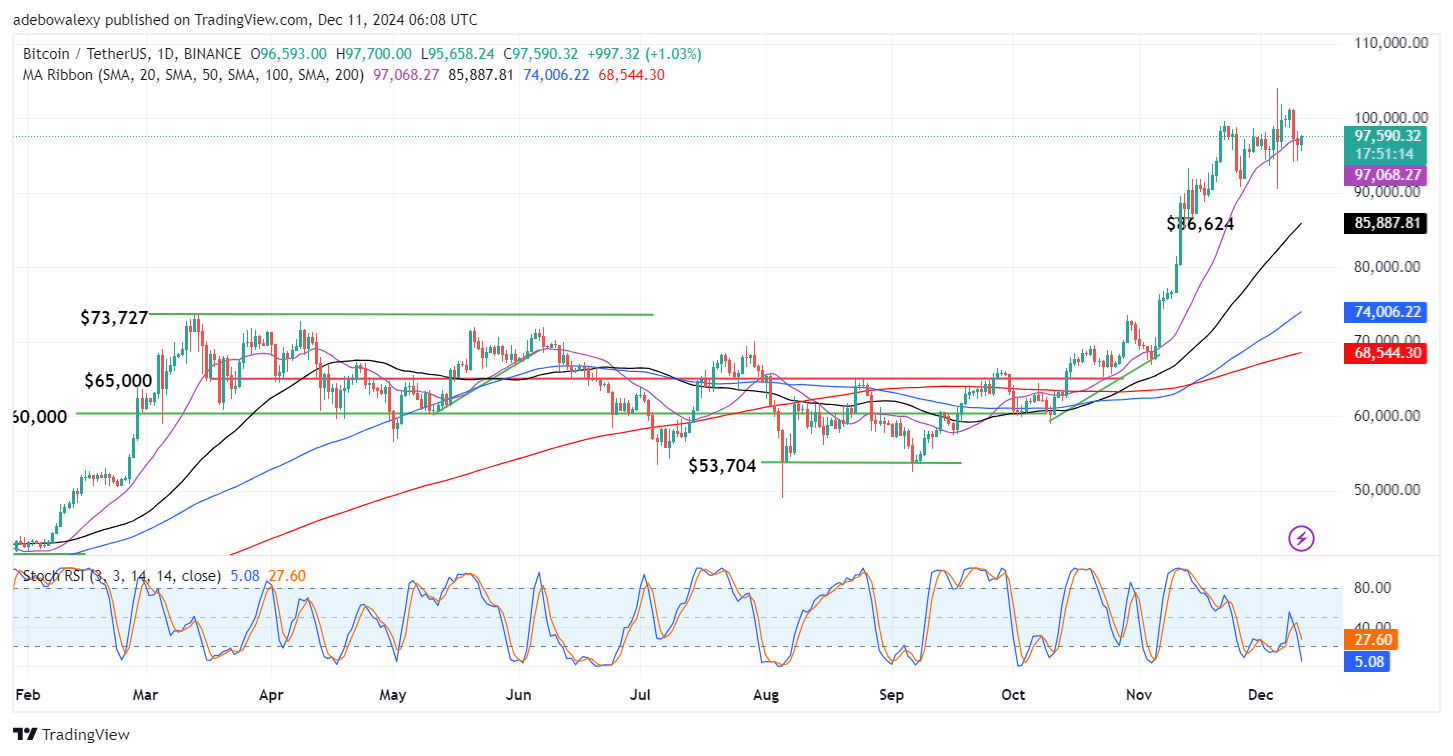
The last price candle on the Bitcoin daily chart has appeared bullish. Consequently, it has placed the price of this crypto above the 20-day Moving Average (MA) line. Also, this keeps the token now trading above all the MA lines on the price chart. Despite this, the Stochastic Relative Strength Index (RSI) lines have fallen deep into the oversold region due to the sharp downward correction of the past two sessions.
Bitcoin (BTC) Price Prediction: Traders May See Short-Term Gains in the BTC/USDT Market
Looking at activities on the Bitcoin daily chart, one can see that despite the numerous setbacks in the token’s movement, price action has managed to keep making higher lows. Also, the current position of the last price candle above all the MA lines suggests that the market may still be in an uptrend.
While the price action has only poked through the 20-day MA line, it does seem likely that prices may progress higher, seeing that traders may now grow more confident of at least short-term gains. Consequently, the movement of the Stochastic RSI may be ignored for short-term gains in this market.
Bitcoin (BTC) Price Prediction: BTC/USDT Short-Term Gains Face a Strong Challenge (4-Hour Chart)
The Bitcoin market on the 4-hour chart has revealed that indeed this market has a short-term bullish outlook. The mentioned upside retracement has spanned 16 hours, and the market has been on this track for the past three sessions. As a result, the market has risen past the 100- and 200-day MA lines. Likewise, the Stochastic RSI lines are rising sharply upwards. The lead line can be seen rising faster and wider.
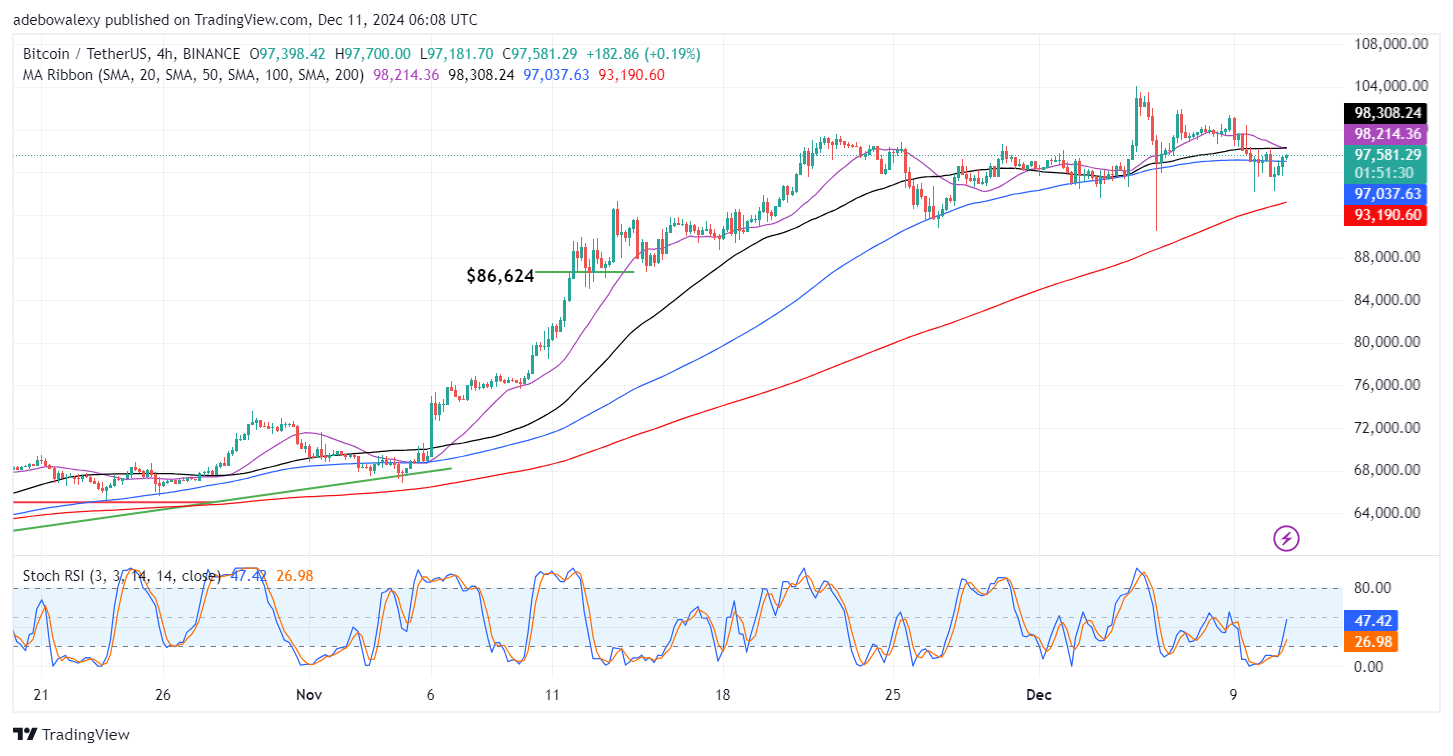
Indicators arising from technical analysis suggest that price action does have a short-term bullish outlook. However, the crossover delivered by the 20- and 50-day MA lines poses a strong barrier to upside movement. Nevertheless, price action may approach the $98,500 mark, but a break above this mark may signal stronger price moves toward the $100,000 mark.