Litecoin (LTC) Price Prediction: LTC/USDT Bulls Took a Heavy Blow
Estimated Reading Time: 3 minutes
Don’t invest unless you’re prepared to lose all the money you invest. This is a high-risk investment and you are unlikely to be protected if something goes wrong. Take 2 minutes to learn more

Litecoin (LTC) Price Prediction December 10:
The Litecoin daily market took a heavy blow from bears in the previous session. This caused a massive downward retracement, bringing the market to now trade just above the $110 price level from well above the $130.
LTC/USDT Long-Term Trend: Bearish (Daily Chart)
Key Price Levels:
Resistance: $115, $120, $125
Support: $110, $105, $100
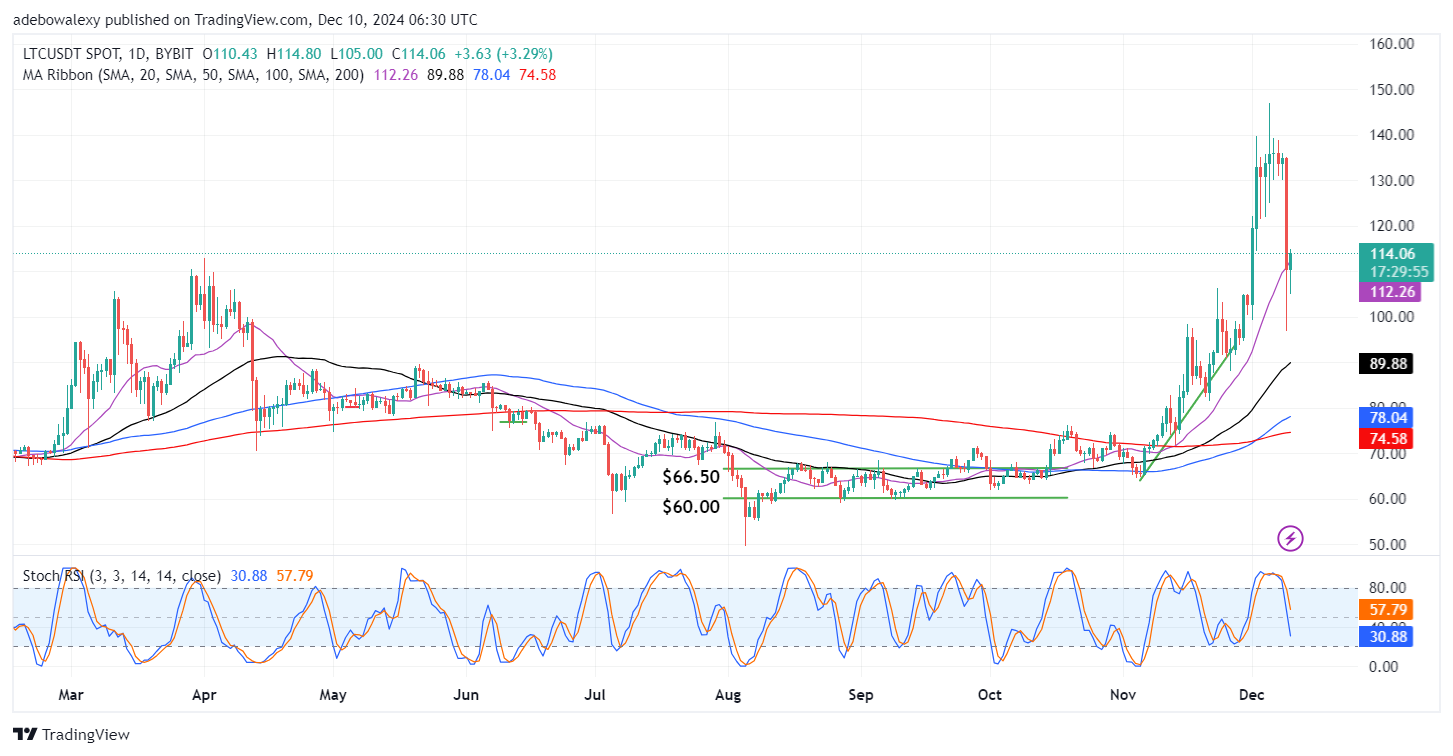
Nevertheless, the ongoing session has recovered above all the Moving Average (MA) curves. The $110 price level has proved to be a strong baseline as price action has held above that price level. Subsequently, the ongoing session has continued upward off that mark, causing an upside correction. Meanwhile, the Stochastic Relative Strength Index (Stochastic RSI) lines still have the outlook of the previous session as it keep plunging into the oversold region undeflected.
Litecoin (LTC) Price Prediction: LTC/USDT Baseline Holds Tight
It is seen through the Litecoin daily chart that price activity is quite volatile. However, despite the negative effect of price volatility, one thing remains evident: bulls are trying to hold their ground. The previous session saw a significant downward retracement that brought the market below multiple technical support levels.
However, the ongoing session has seen the price of the token rise past the 20-day MA line. At this point, the market now trades above all the MA curves. Albeit, due to the significant downward retracement in the previous session, the Stochastic RSI lines are still pointed sharply into the oversold region without reflecting the current upside rebound.
Litecoin (LTC) Price Prediction: LTC/USDT Buyers Still Keep the $110 Support Level Solid (4-Hour Chart)
In the Litecoin 4-hour market, we can see that price action has managed to rise above the 100-day MA line. Likewise, the last price candle keeps the market above the $110 price level. The Stochastic RSI lines are in the oversold region but have delivered an upward crossover there. The ensuing lines can be seen rising upward.
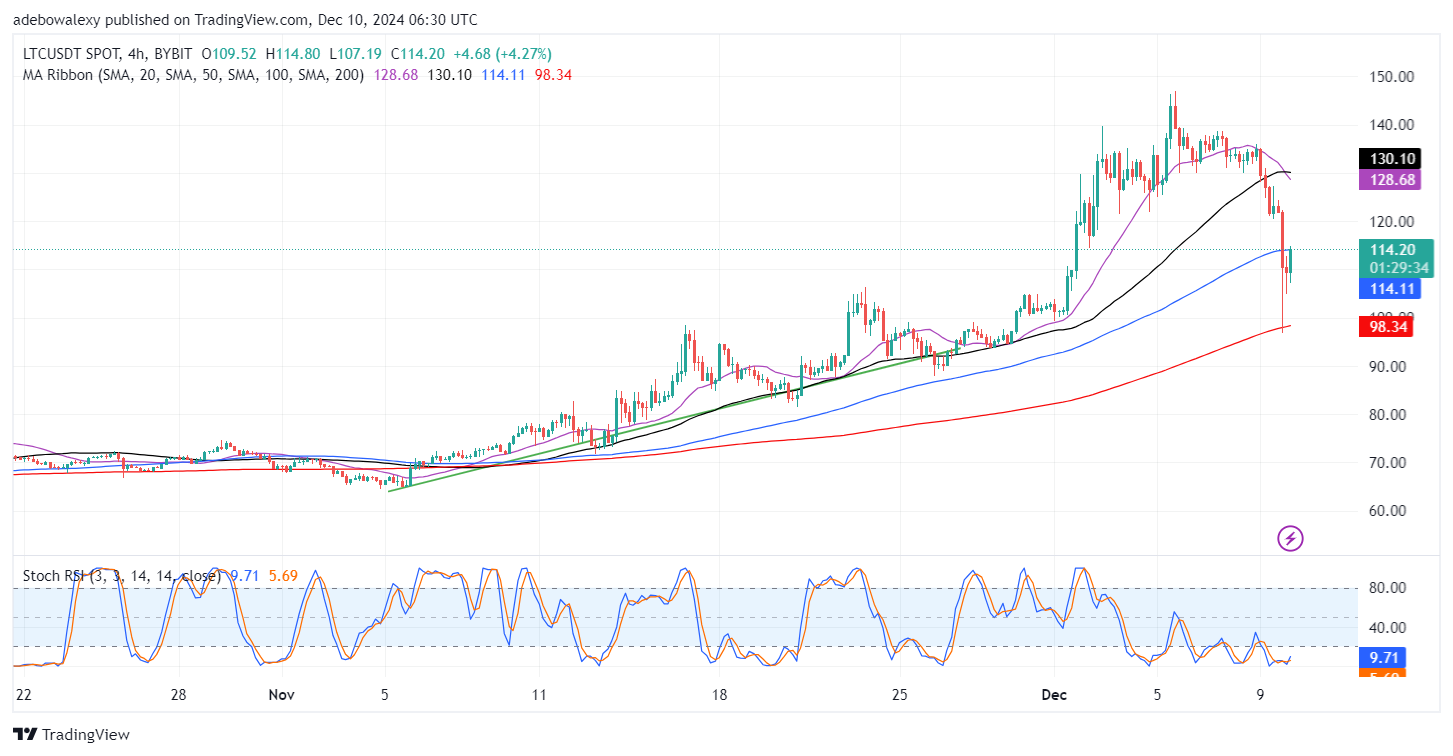
Technically, this still supports the short-term view of the market, hinting at the fact that price action has a fair chance of rising upward. The last price candle has pipped through the 100-day MA line, hinting at fair chances of prices approaching the $120 price level.