Polygon (ex-MATIC) Price Prediction: POL/USDT Retains a Bullish Outlook
Estimated Reading Time: 3 minutes
Don’t invest unless you’re prepared to lose all the money you invest. This is a high-risk investment and you are unlikely to be protected if something goes wrong. Take 2 minutes to learn more

Polygon (ex-MATIC) Price Prediction December 7:
The Polygon (ex-MATIC) coin has seen impressive upside retracements. This has been ongoing in recent sessions. Even at this point, the market still has a favorable stance that suggests that upside forces are still dominant.
POL/USDT Long-Term Trend: Bearish (Daily Chart)
Key Price Levels:
Resistance: $0.8000, $0.9000, $1.000
Support: $0.7000, $0.6000, $0.5000
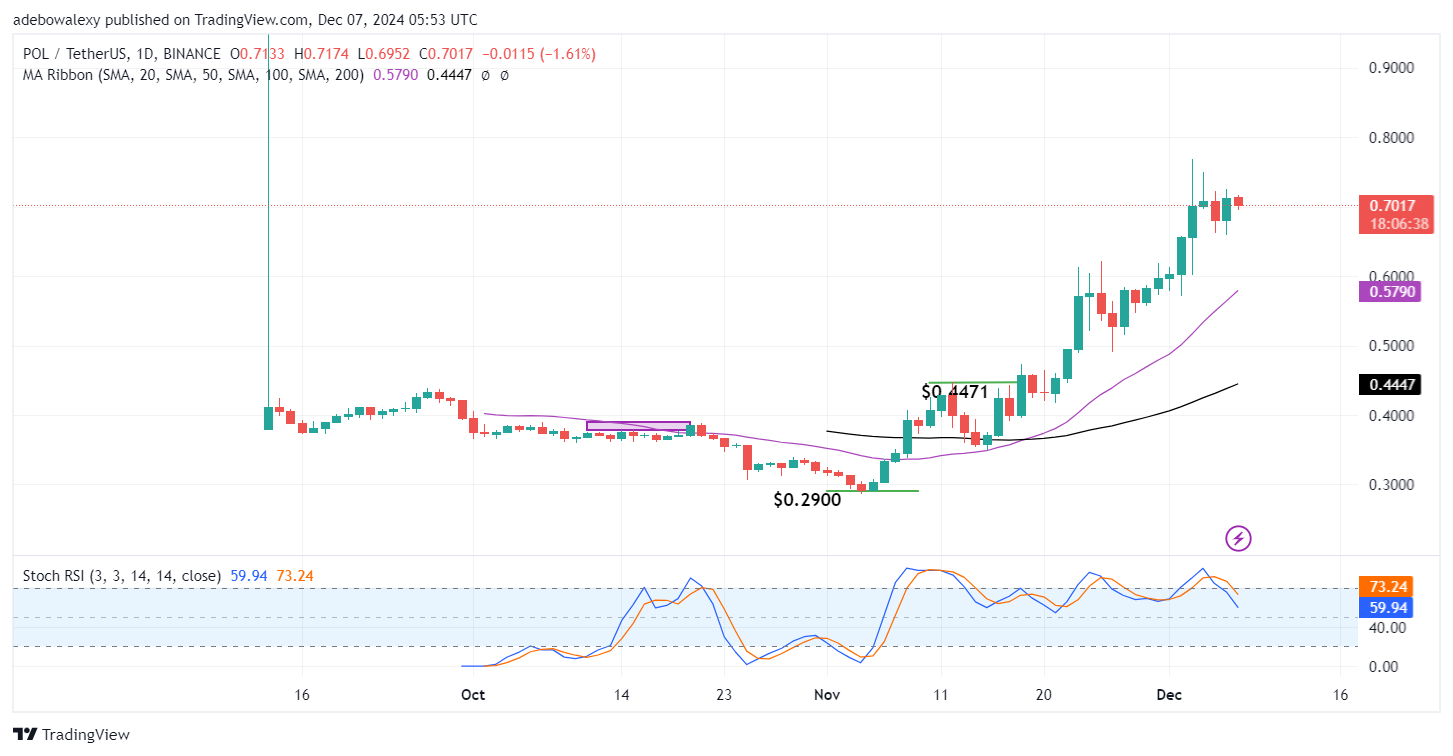
The ongoing session has produced minor downward retracements. However, the corresponding price candle keeps the price of the token above the open level of the previous session. Likewise, the last price candle on the chart stands above all the Moving Average (MA) lines. Meanwhile, the Stochastic Relative Strength Index (RSI) indicator curves are descending toward the 50 level of the indicator, with the lead line at 59.94 and the lagging line now at 73.24.
Polygon (POL) Price Prediction: POL/USDT Stays Largely Afloat
While the ongoing session in the Polygon (ex-MATIC) market has produced a minor price decline, it seems that the uptrend is largely preserved. The last price candle on the chart keeps the price of the token above the opening of the previous session. Also, its stand above all the available MA lines can be seen to give the upside force an edge over the downward force.
Furthermore, the movement of the Stochastic RSI lines seems too exaggerated, and as such, may not be correctly reflecting the long-term outlook of the market. Its downward trajectory may be too sensitive considering that the last price candle still keeps the price of the token above the most recent lows.
Polygon (ex-MATIC) Price Prediction: The $0.7000 Price Mark Seems a Strong Support in the POL/USDT Market (4-Hour Chart)
Price activity in the Polygon (ex-MATIC) 4-hour market seems to have started a rebound off the technical support at the $0.7000 price level. The last price candle can be seen as green, just below the 20-day MA line. Meanwhile, the Stochastic RSI lines can be seen converging at the 40 level of the indicator. And despite the convergence, the indicator line still has an upward trajectory.
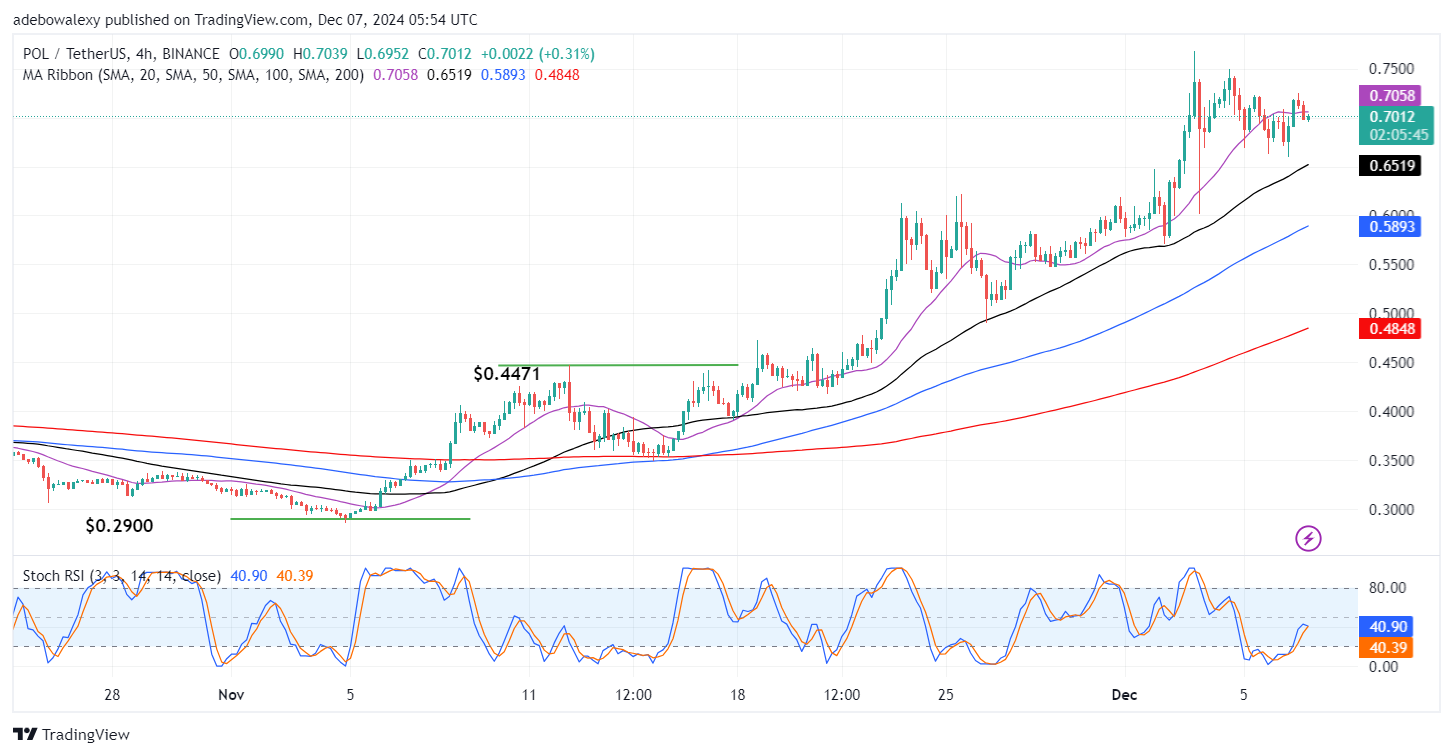
Technically, it seems this market generally has an upward trajectory. The available technical indications still suggest that upward forces are still looking very much favored to extend their activities. The appearance of the last price candle on the 4-hour chart has suggested that the $0.7000 mark may be strong support for an upward rebound toward the $0.7500 price level.


