Solana (SOL) Price Prediction: SOL/USDT Trades Below the $240 Level
Estimated Reading Time: 3 minutes
Don’t invest unless you’re prepared to lose all the money you invest. This is a high-risk investment and you are unlikely to be protected if something goes wrong. Take 2 minutes to learn more

Solana (SOL) Price Prediction December 6:
Price action in the Solana market has been retracing higher ground, albeit at a slower pace, since the market surpassed the $220 threshold. The $260 price level remains a strong resistance to price action. However, price activity still seems to have upside potential, given its position above promising technical landmarks.
SOL/USDT Long-Term Trend: Bullish (Daily Chart)
Key Price Levels:
Resistance: $240, $275, $300
Support: $215, $190, $165
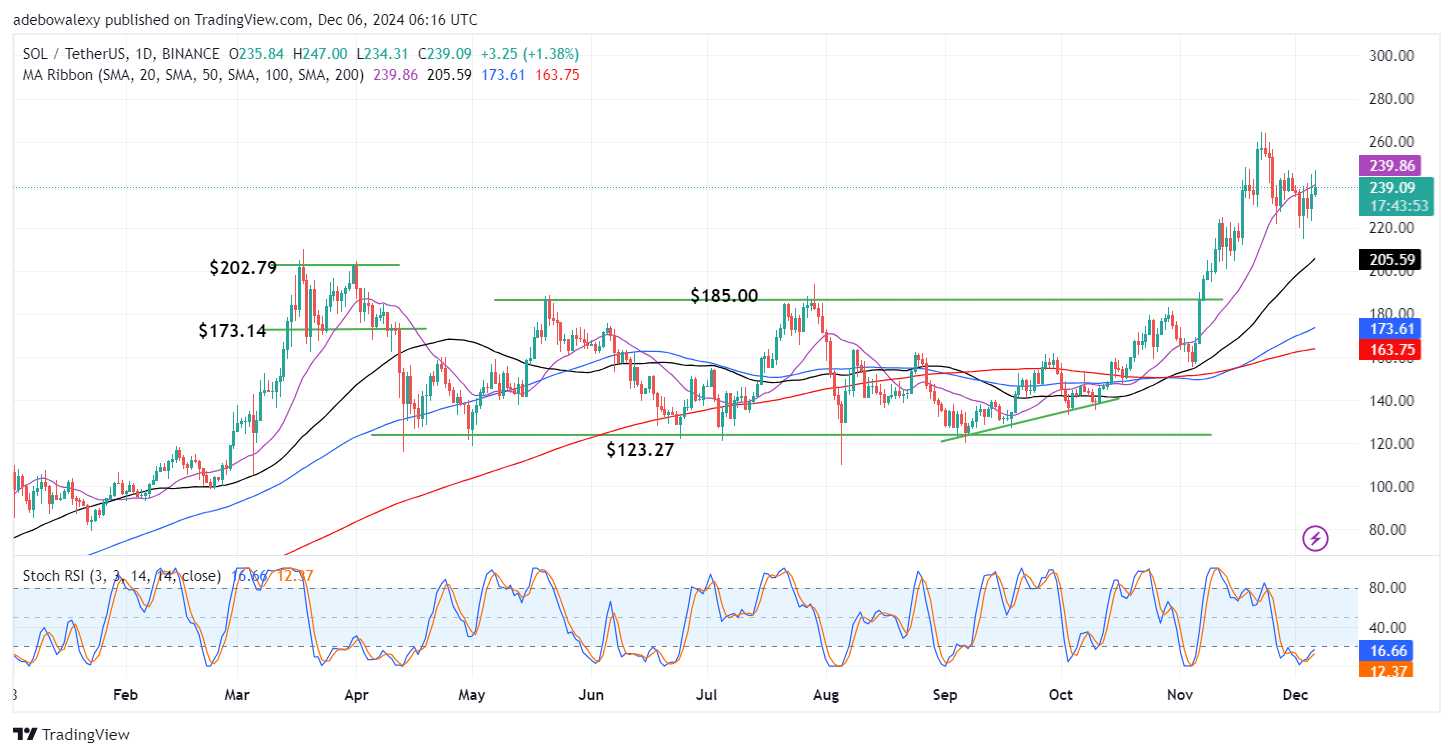
The latest bullish price candle on the Solana daily price chart has shown moderate gains so far. However, downward pressure has caused the market to contract. Nevertheless, the market hovers just below the 20-day Moving Average curve. Additionally, the Stochastic Relative Strength Index lines have fallen into the oversold region. However, the upward trajectory of these lines suggests that the market may still have upward momentum.
Solana (SOL) Price Prediction: SOL/USDT Eyes a Break Through $240 Resistance
A closer look at price activity in the Solana daily market reveals that buyers are aiming to break through the next technical resistance. The previous session’s bullish price candle has appeared on the price chart. However, the 20-day MA line has formed an effective resistance, causing the market to retreat below the $240 price level.
Nonetheless, price action remains above most of the MA lines, suggesting a potential upside. The trajectory of the Stochastic RSI lines indicates that upward forces are strong and may lead to significant upward movement in subsequent sessions.
Solana (SOL) Price Prediction: SOL/USDT Buyers Holding Tight to Previous Gains (4-Hour Chart)
The latest price candle on the Solana 4-hour chart reveals a short-term price decline. The price candle has brought the market below the 100-day MA line. However, the market remains above the 20-, 50-, and 200-day MA curves. Additionally, the Stochastic RSI indicator has formed a bullish crossover while remaining above the 60 mark.
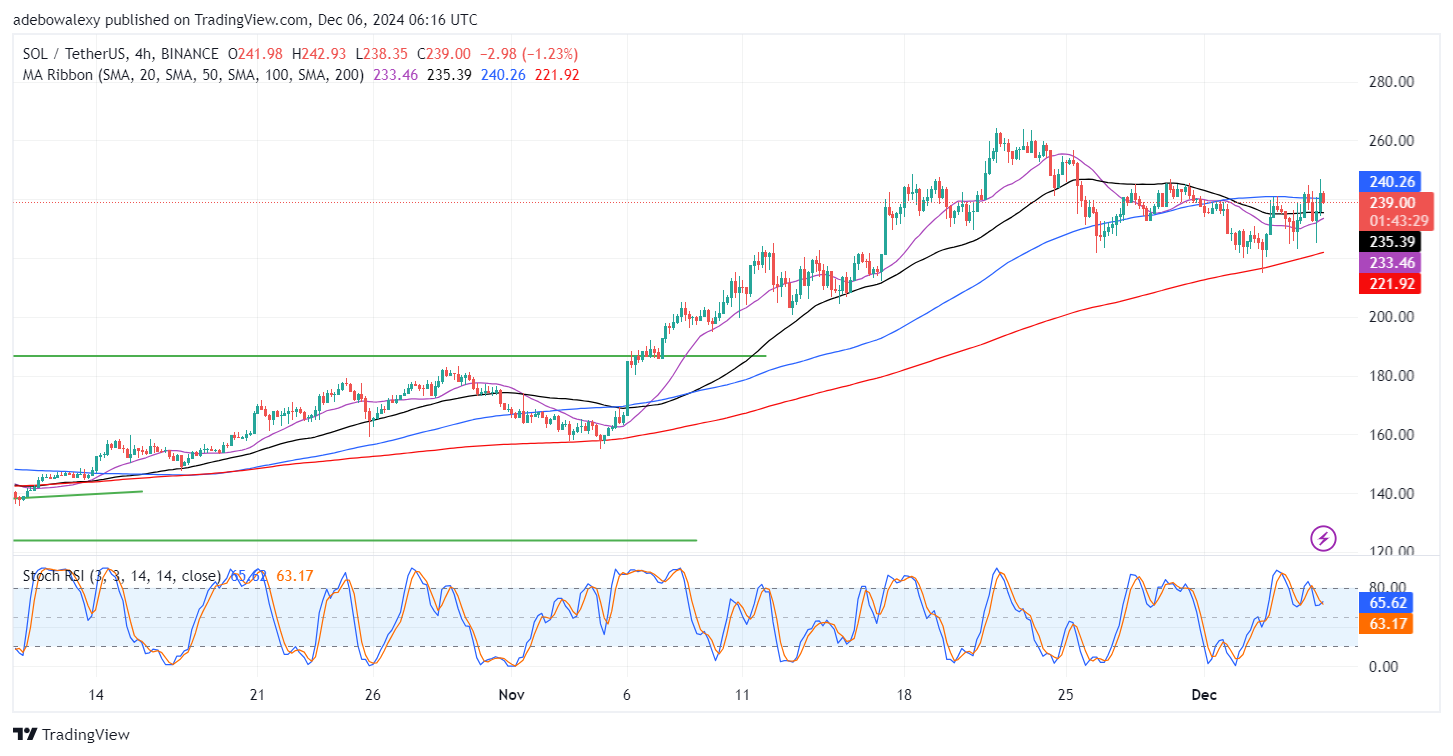
Therefore, since price action remains above most of the MA curves, especially the 20- and 50-day MAs, the uptrend may still be intact. Likewise, the crossover on the Stochastic RSI confirms that upward forces are likely to support the market. This could potentially lead to an upward correction through the $240 mark and toward the $300 mark.