Uniswap (UNI) Price Prediction: UNI/USDT Trades a Progressive Market
Estimated Reading Time: 3 minutes
Don’t invest unless you’re prepared to lose all the money you invest. This is a high-risk investment and you are unlikely to be protected if something goes wrong. Take 2 minutes to learn more

Uniswap (UNI) Price Prediction December 5:
Price movement in the Uniswap market has been progressing upward in an orderly manner. Price action here can be seen making a series of higher lows. As a result, the market has been moving after locating a new but higher support.
UNI/USDT Long-Term Trend: Bearish (Daily Chart)
Key Price Levels:
Resistance: $17, $20, $23
Support: $16, $13, $10
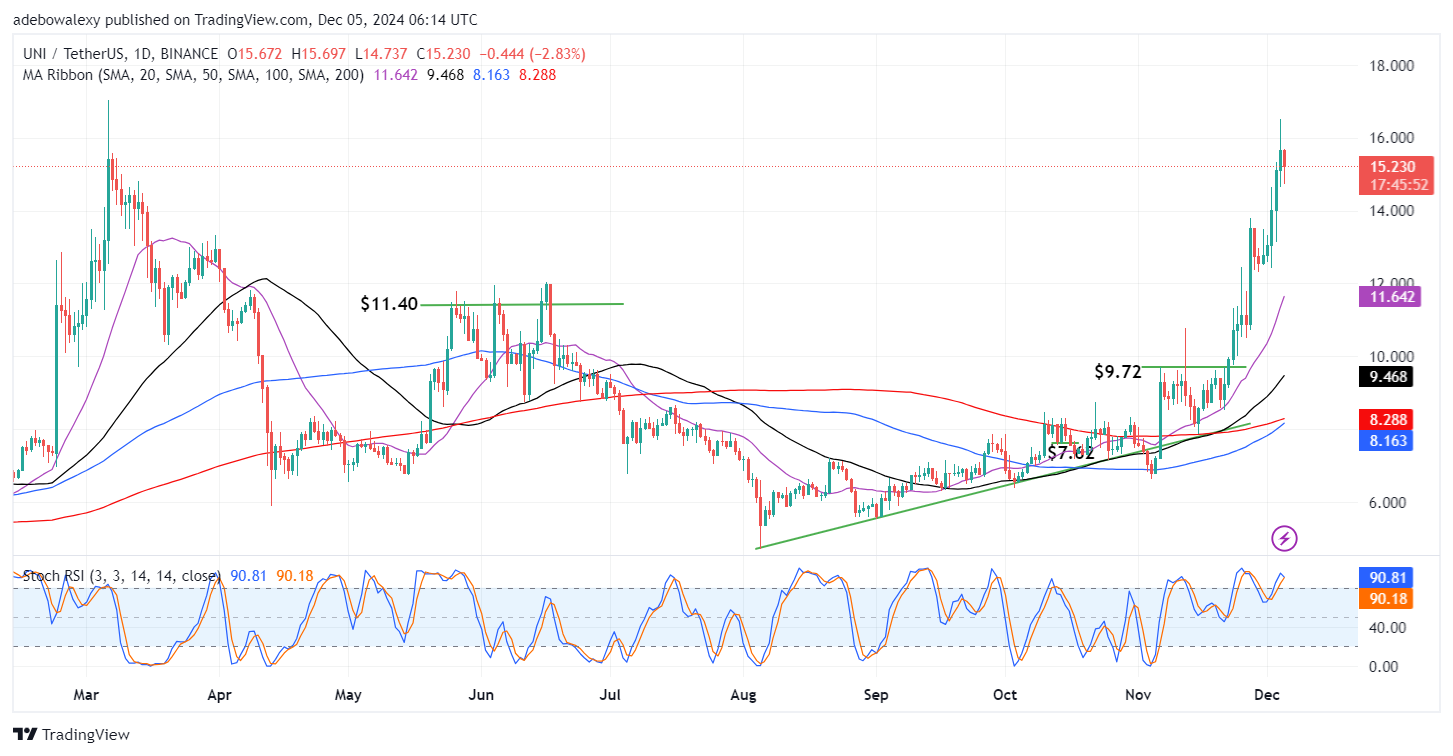
The ongoing session shows that price action has rebounded downwards after poking the resistance at the $16 level. The last price candle can be seen appearing red and posting short-term losses towards the $15 support level. Meanwhile, the Stochastic Relative Strength Index (RSI) indicator can be seen falling sharply, approaching a bearish crossover in the overbought region of the indicator. Nevertheless, price action stays above all the Moving Average (MA) ribbons on the chart.
Uniswap (UNI) Price Prediction: UNI/USDT Bounces Off a Higher Support
The Uniswap market is recording impressive progress. Not that it hasn’t seen some stops along the way, but the market has been quick to recover from such setbacks. The last price candle on the chart can be seen appearing red but standing just above the technical support at the $15 mark.
What’s more is that price action still lies above all the MA lines on the chart, even as the RSI lines sharply approach a bearish crossover. It is worth noting that the ongoing session hasn’t erased previous gains seen in the previous session. Technically, it appears that upside forces may still have the upper hand in subsequent sessions as they have all favorable grounds to push the market higher.
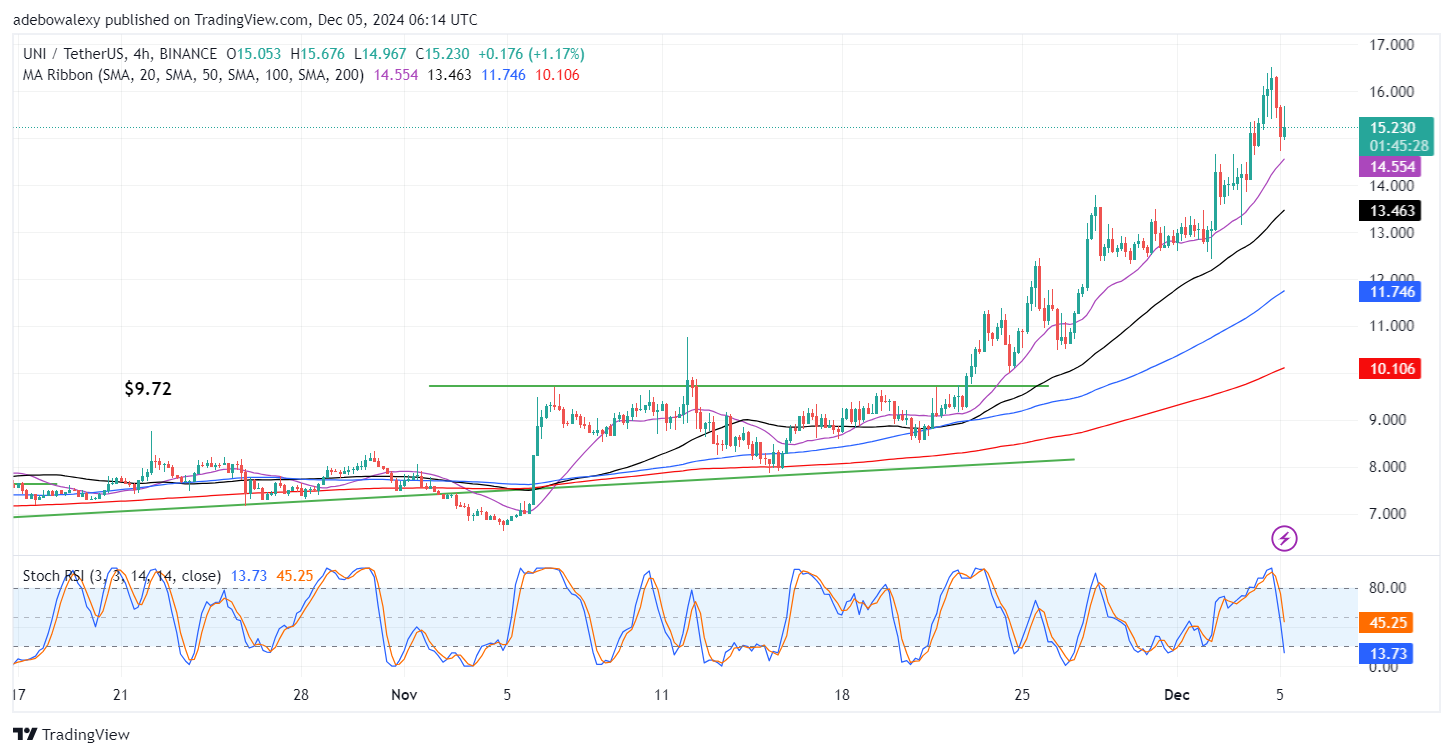
Uniswap (UNI) Price Prediction: UNI/USDT Still Has a Bullish Outlook (4-Hour Chart)
The ongoing session shows that price action has once again rebounded off a higher support level. The last price candle here can be seen appearing green and posting moderate gains of the $15 support level. The market subsequently contracted downwards, leaving the session with lesser gains. Meanwhile, the Stochastic Relative Strength Index (RSI) indicator can be seen falling very sharply into the oversold region. Nevertheless, price action stays above all the Moving Average (MA) ribbons on the chart.
The Uniswap market is recording impressive progress. Not that it hasn’t seen some stops along the way, but the market has been quick to recover from such setbacks. The last price candle on the chart can be seen standing just above the technical support at the $15 mark. What’s more is that price action still lies above all the MA lines on the chart, despite the sharp descent of the Stochastic RSI lines. It is worth noting that the ongoing session stays in the green despite the downward contraction. Technically, it appears that upside forces may still have the upper hand in subsequent sessions. This will eventually see the market progress upward toward the $17 resistance level.