Lucky Block (LBLOCK) Shows Positive Potential Amid Minor Pullback
Estimated Reading Time: 3 minutes
Don’t invest unless you’re prepared to lose all the money you invest. This is a high-risk investment and you are unlikely to be protected if something goes wrong. Take 2 minutes to learn more

Lucky Block (LBLOCK) has recently experienced a slight dip, with the price currently trading around $0.00001710, representing a 2.45% decline. Despite this, the overall market outlook remains optimistic as key indicators show signs of possible upward momentum in the near future.
Daily Chart Analysis of Lucky Block
The daily chart reveals that LBLOCK is trading within a tight range, with support at approximately $0.00001651 and resistance at $0.00002050. The Bollinger Bands are narrowing, indicating that a breakout could be on the horizon. The current price is just below the middle band, suggesting that a push to the upper band, around $0.00002050, is possible if buying pressure increases.
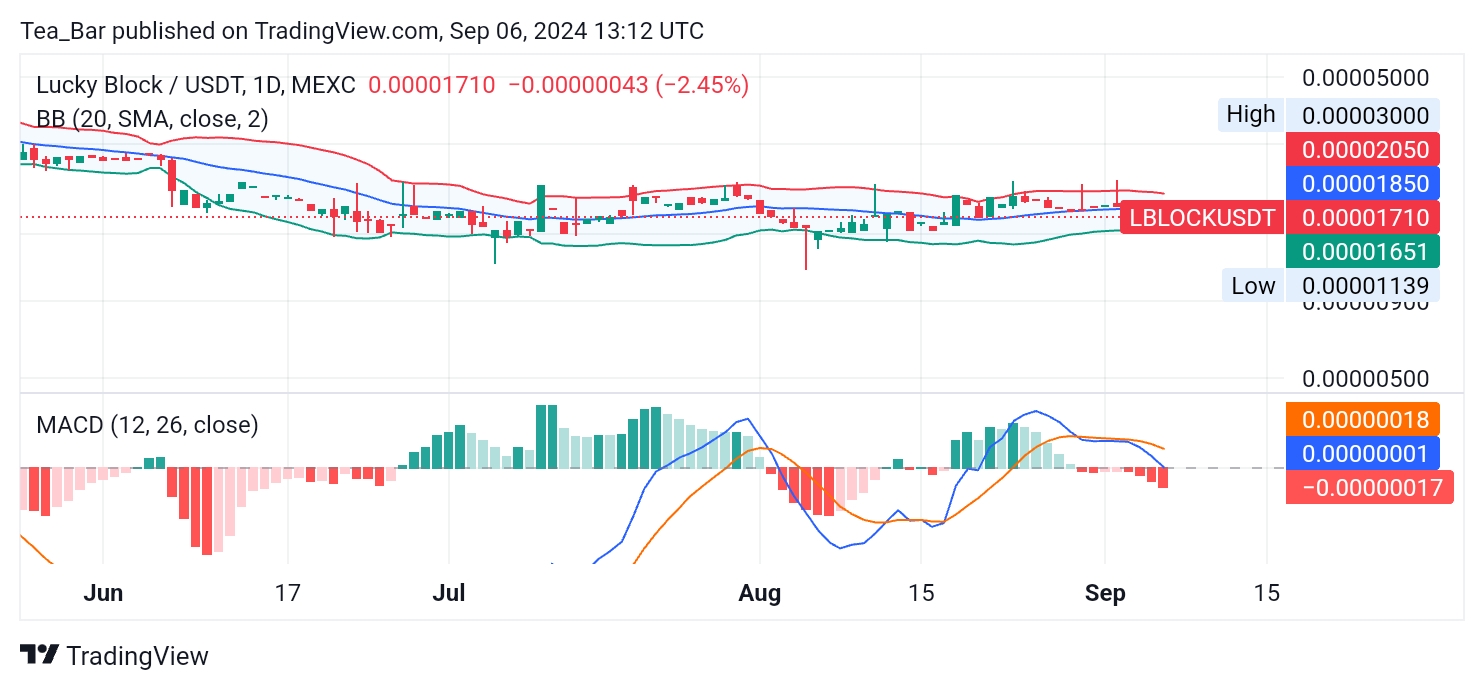
The MACD indicator shows signs of weakening bearish momentum, as the histogram bars are decreasing. This shift could pave the way for LBLOCK to retest its resistance levels in the coming sessions.
4-Hour Chart Analysis
On the 4-hour chart, Lucky Block (LBLOCK) is experiencing mild consolidation, hovering near the $0.00001710 level. The Bollinger Bands on this shorter time frame are tighter than those on the daily chart, further emphasizing that the market is preparing for a larger move. Support remains strong at $0.00001710, while resistance is visible at $0.00001729.
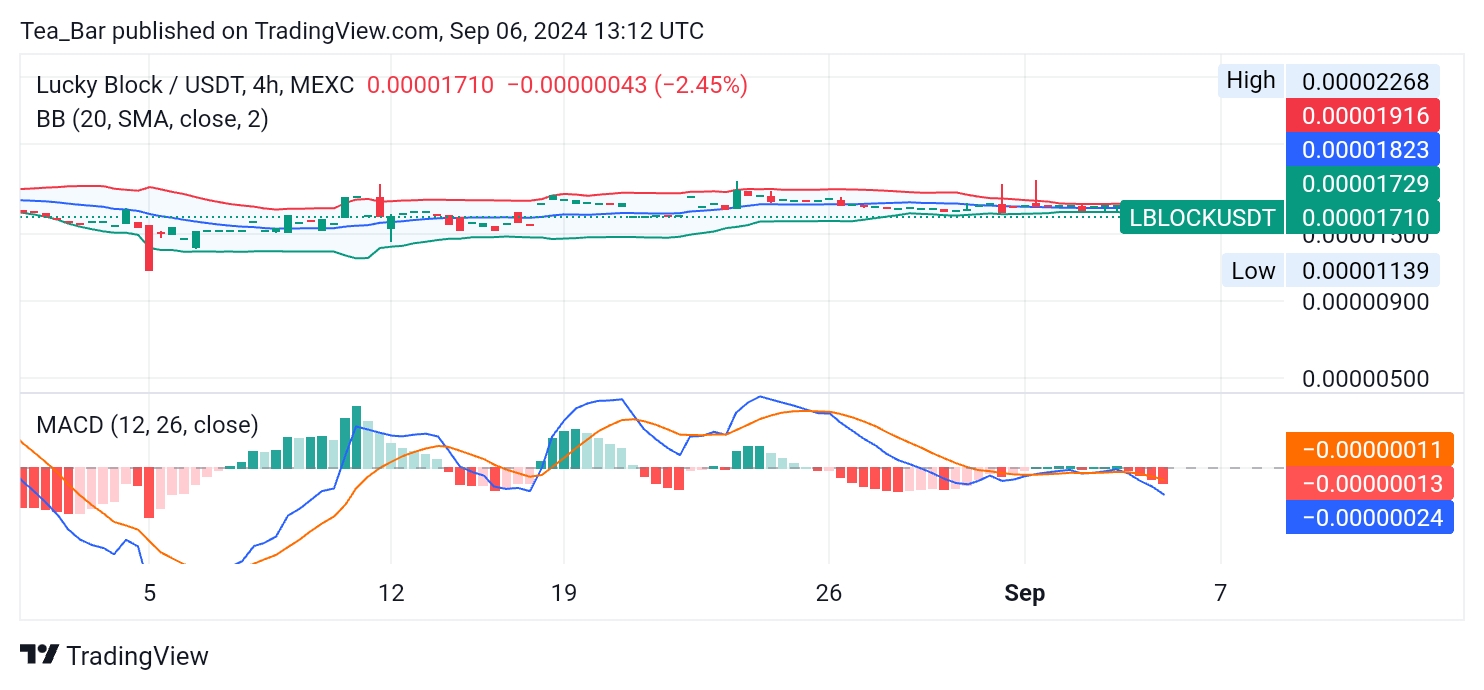
The MACD indicator on the 4-hour chart echoes the signals from the daily chart, showing decreasing bearish momentum and a potential crossover in the near future. A positive shift in momentum could propel LBLOCK towards a higher range, potentially breaking the resistance level.
Conclusion
While Lucky Block (LBLOCK) is currently experiencing minor price fluctuations, the technical indicators suggest that it is preparing for a bullish breakout. Traders should keep an eye on key resistance levels at $0.00002050 on the daily chart and $0.00001729 on the 4-hour chart.
A breach of these levels could lead to a significant upward movement, making LBLOCK an asset to watch closely in the coming days.
You can purchase Lucky Block here. Buy LBLOCK.