Lucky Block (LBLOCK) Showing Strong Support and Potential Upside
Estimated Reading Time: 3 minutes
Don’t invest unless you’re prepared to lose all the money you invest. This is a high-risk investment and you are unlikely to be protected if something goes wrong. Take 2 minutes to learn more

Lucky Block (LBLOCK) has recently been displaying a positive trend, supported by a strong foundation in both the daily and 4-hour charts. This analysis highlights the promising indicators that could signal a bullish movement in the near future.
Daily Chart Analysis of Lucky Block
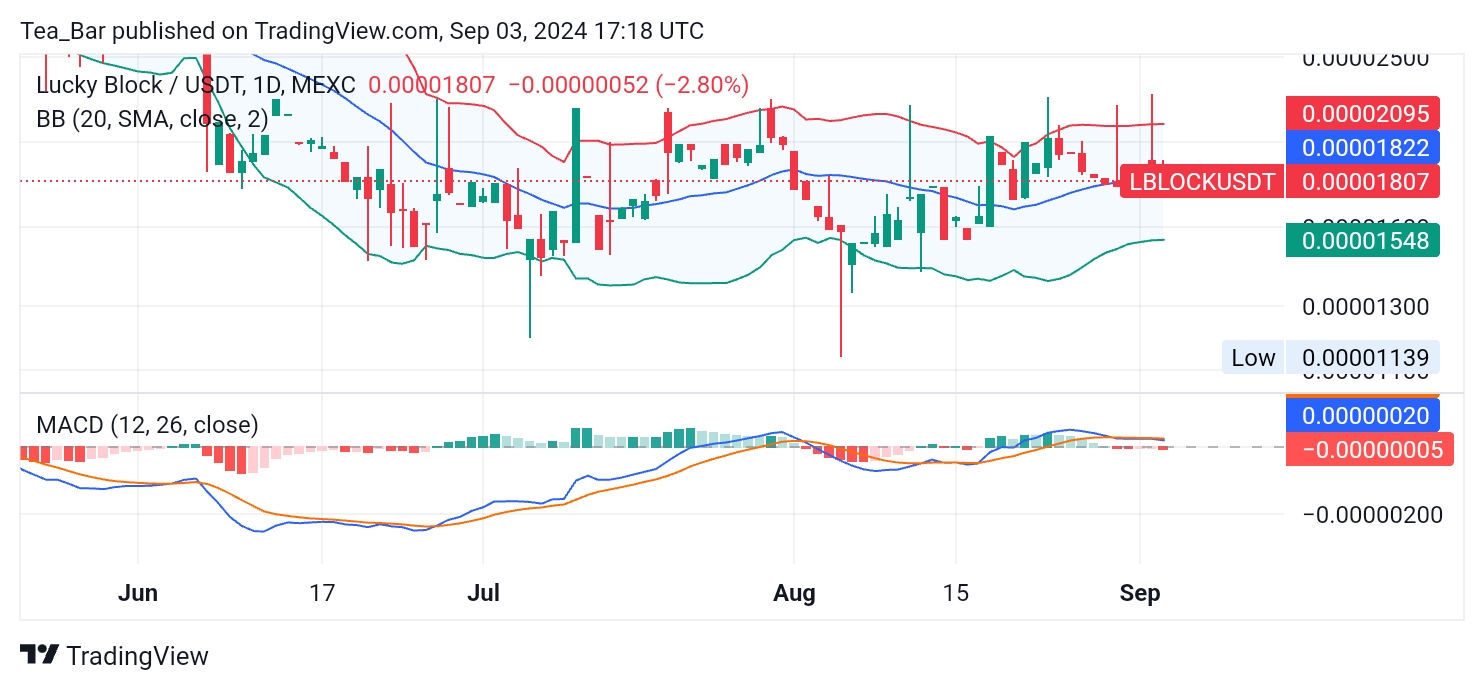
On the daily chart, LBLOCK is trading at approximately $0.00001807, reflecting a slight dip of 2.80%. Despite this, the Bollinger Bands show a narrowing range, indicating reduced volatility, which often precedes a breakout. The price is closely hugging the lower band, suggesting that LBLOCK might be oversold, and a potential reversal could be on the horizon.
The MACD (12, 26, close) remains in a slightly bearish zone, but the histogram shows signs of convergence, which could signal a shift towards bullish momentum. If LBLOCK continues to hold above the support level of $0.00001548, it may soon challenge the resistance at $0.00002095.
4-Hour Chart Analysis
In the 4-hour timeframe, LBLOCK maintains stability around $0.00001807, with the Bollinger Bands also suggesting consolidation. The upper band at $0.00001893 serves as the immediate resistance, while the lower band provides support at $0.00001779. This tight range could lead to a breakout, with the potential for LBLOCK to climb towards $0.00002268 if buying pressure increases.
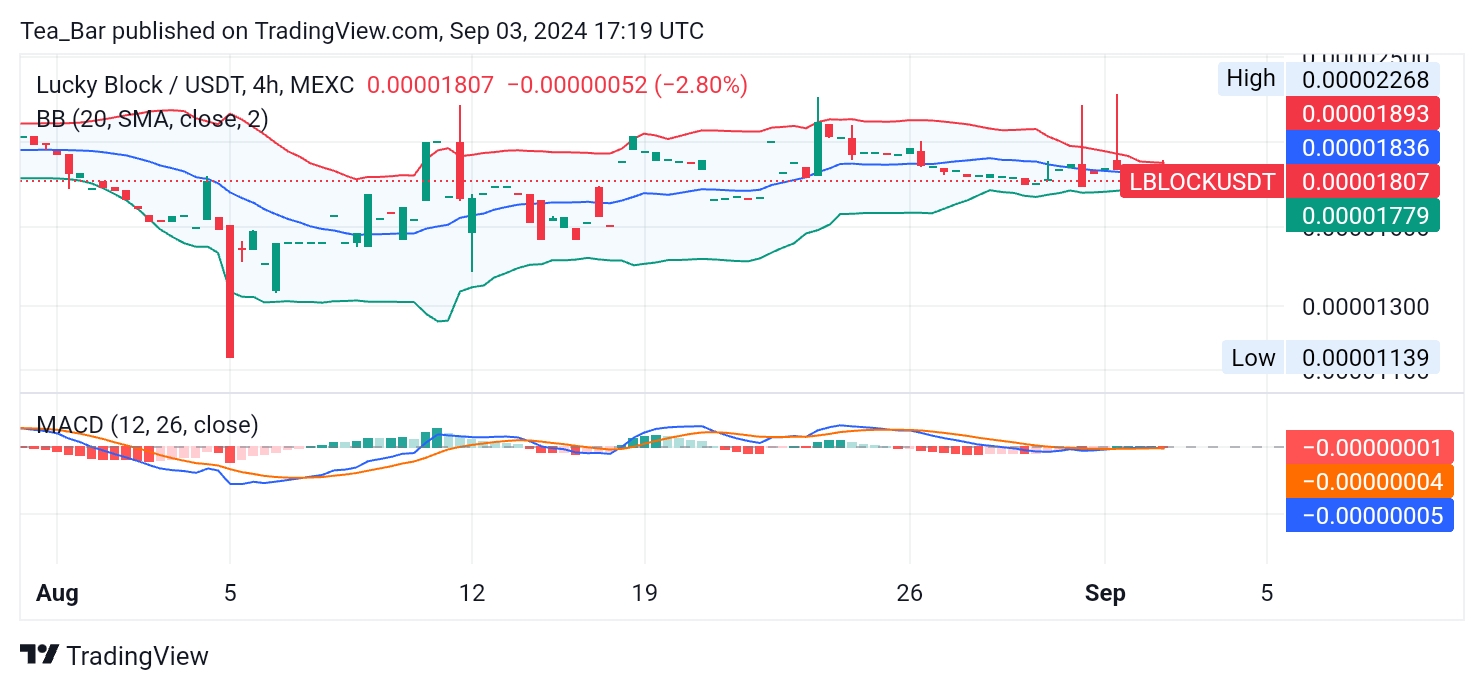
The MACD on the 4-hour chart mirrors the daily chart, with signs of a possible bullish crossover. A successful break above the resistance level could set the stage for a continued upward trend as LBLOCK thrives in the crypto community.
Conclusion
Lucky Block (LBLOCK) is currently navigating a critical juncture, with technical indicators hinting at a possible bullish breakout. With strong support levels in place and potential for upward momentum, LBLOCK could be poised for a positive movement in the near future. Market participants should keep an eye on the key resistance levels, as a breach could lead to significant gains.
You can purchase Lucky Block here. Buy LBLOCK.