Bitcoin (BTC) Price Prediction: BTC/USDT Looks Burdened Below $100,000 Mark
Estimated Reading Time: 3 minutes
Don’t invest unless you’re prepared to lose all the money you invest. This is a high-risk investment and you are unlikely to be protected if something goes wrong. Take 2 minutes to learn more

Bitcoin (BTC) Price Prediction December 4:
Price action in the BTC market has stayed largely trapped between the $100,000 and $95,000 price levels. Although price action remains above important landmarks, suggesting that future bullish hopes are not yet dashed, prices may continue upward in subsequent sessions.
BTC/USDT Long-Term Trend: Bearish (Daily Chart)
Key Price Levels:
Resistance: $100,000, $105,000, $110,000
Support: $95,000, $90,000, $85,000
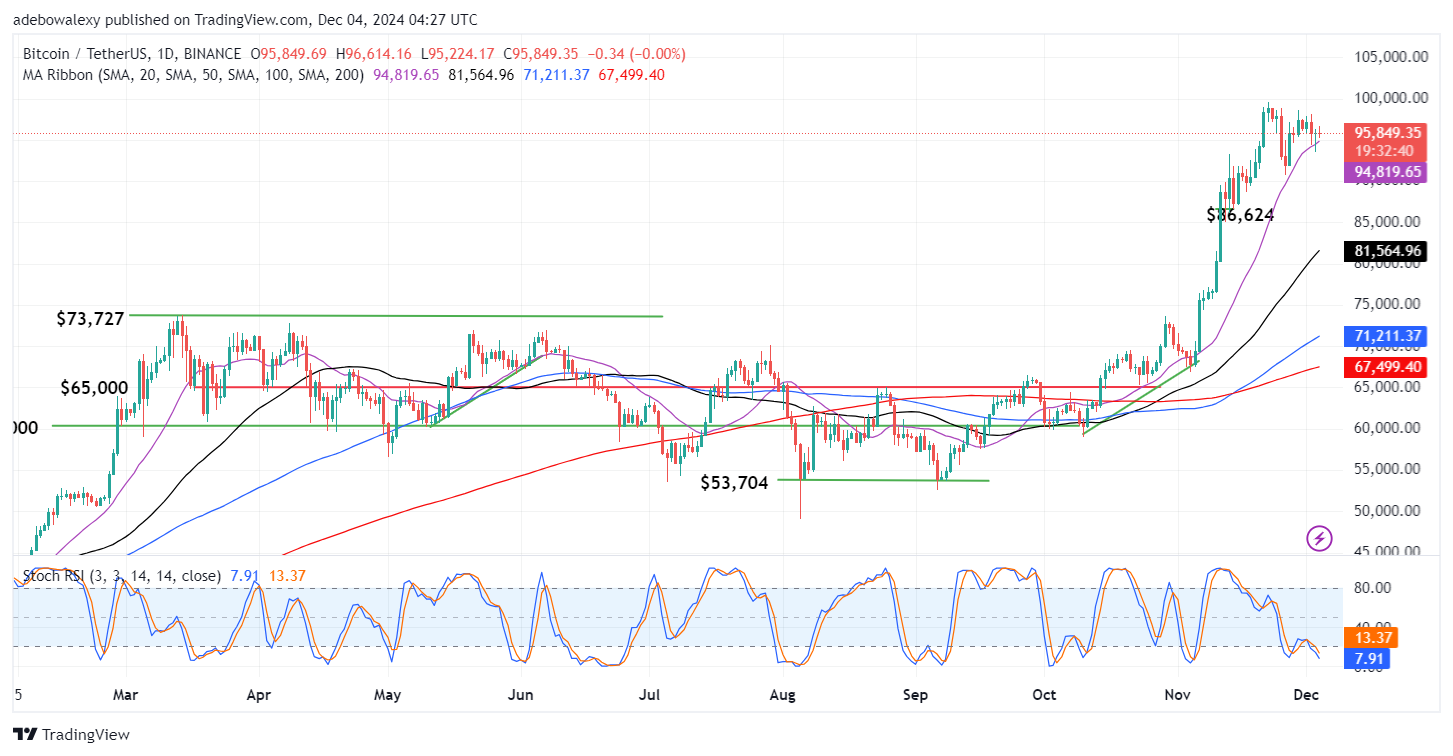
Price movement in the Bitcoin daily market looks quite contracted, with price candles appearing to have small bodies. The last price candle is red but has appeared above all the Moving Average (MA) lines, particularly just above the 20-day MA line. Meanwhile, the Stochastic Relative Strength Index (RSI) lines can be seen falling deeper into the oversold region. This seems a bit contrasting to the behavior of the price chart, as the market isn’t declining significantly at this point.
Bitcoin (BTC) Price Prediction: BTC/USDT Hovers Above the 20-Day MA Curve
The Bitcoin market has stagnated just below the $100,000 price level ever since the market tested the $100,000 resistance. More recently, the market has been caught in the regions of $95,000 and $100,000 resistance levels. The current price region lies above all the MA lines. Also, price action seems more contracted since the previous session.
Meanwhile, the Stochastic RSI lines are still descending into the oversold region of the indicator, but price action isn’t declining significantly, as the market seems to be moving in an almost straight line. However, since the market stays above the MA ribbons, price action may progress upwards soon.
Bitcoin (BTC) Price Prediction: BTC/USDT Has a Short-Term Bullish Outlook (4-Hour Chart)
Price activity in the Bitcoin 4-hour chart suggests that upside forces are active on the short-term front. Here, price action has fallen below the 20-day MA line. However, the market can be seen to have fallen just above the occurring crossover at the 50- and 100-day MA lines. The last price candle is green, hinting that upside forces are in the lead. Additionally, the Stochastic RSI lines are now having an upward trajectory and are now around the 50 mark of the indicator.
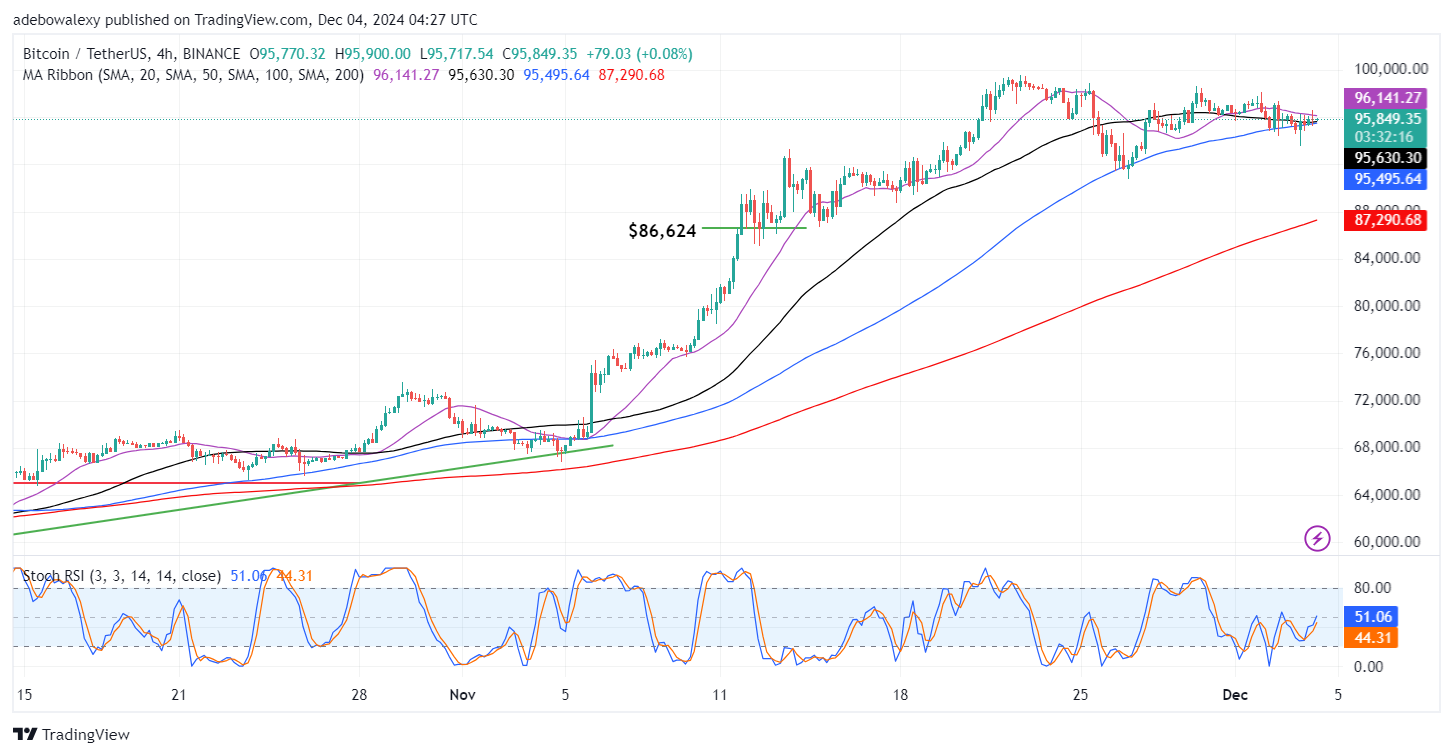
Therefore, while the market seems not to be moving considerably at the moment, it could be seen that price action has a short-term bullish outlook considering signs coming from technical indicators. Therefore, we may see the market approach the $98,000 mark initially.