Ripple (XRP/USDT) Gains Momentum, Eyes Breakout
Estimated Reading Time: 3 minutes
Don’t invest unless you’re prepared to lose all the money you invest. This is a high-risk investment and you are unlikely to be protected if something goes wrong. Take 2 minutes to learn more
Ripple Long-term Analysis: Bullish
Ripple, from the general perspective, has experienced a lot of crypto market fluctuations, which range from investors’ sentiment to macroeconomics. However, the pair has shown resilience amid market volatility, with the pair oscillating within a narrow range, which suggests consolidation and a sign of a potential upside breakout.
The recent formation of the bullish candlestick above the upper band suggests the pair is beginning to build momentum for a potential breakout above the upper Bollinger band. To this end, traders look closely at XRP’s price directional movement as the setup hints at renewed buying interest for the pair.
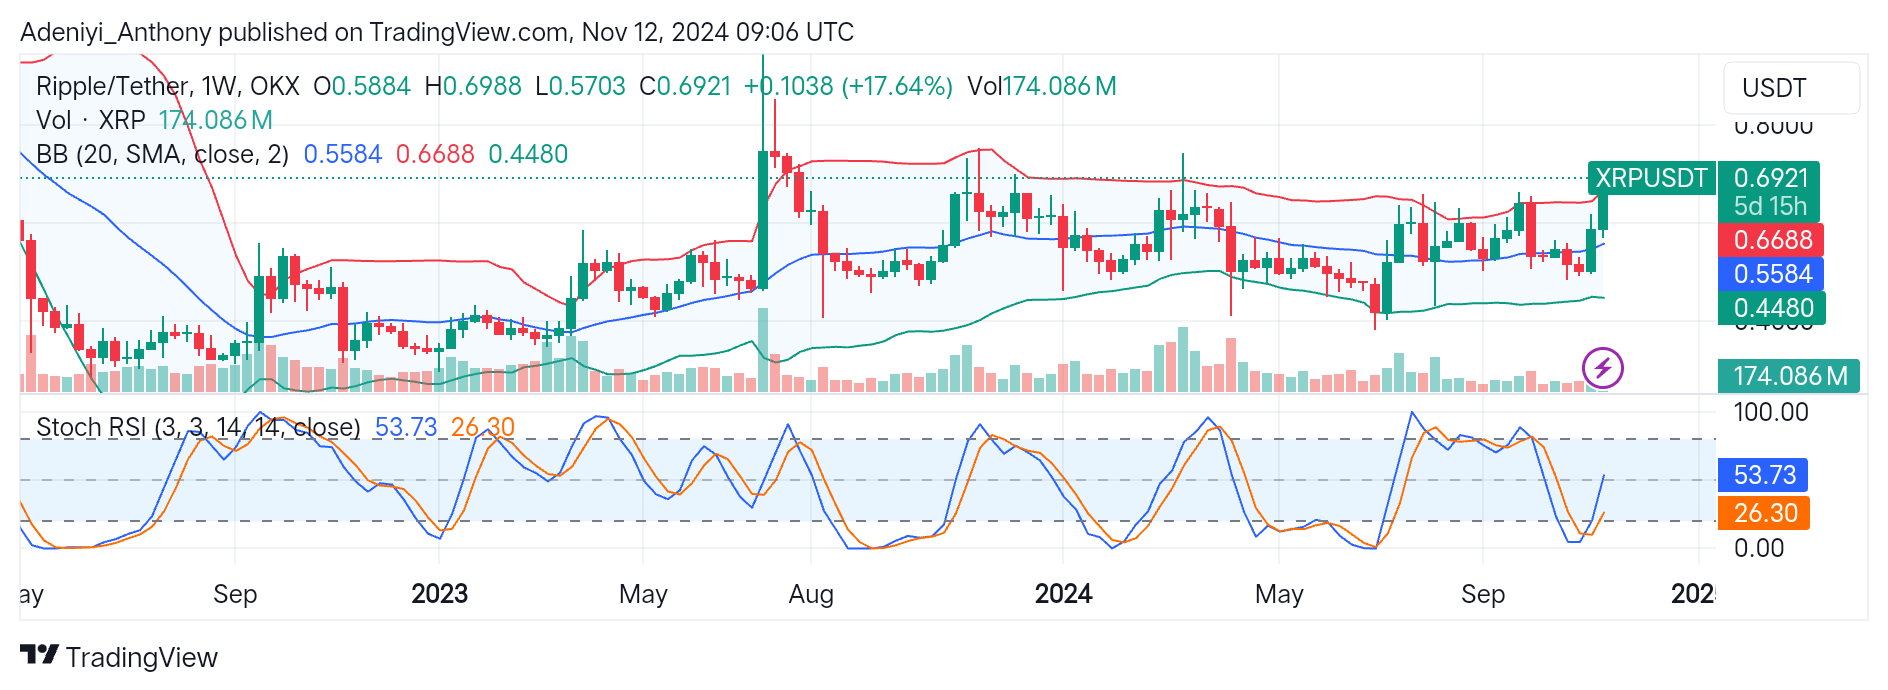
Currently, Ripple is trading at $0.6921 with 174.086 million trading volume, representing a 17.64% positive change compared to the previous session.
Technical Indicator
Major Resistance Levels: $0.6688, $0.7000, and $0.7500
Major Support Levels: $0.55841, $0.5000, and $0.4480
Ripple Technical Analysis
Ripple on a weekly timeframe reveals a bullish setup, with the formation of yet another higher low and movement above the upper Bollinger band. The indicators on the chart above suggest the pair is gaining momentum, and there is a possibility for a clear upside movement soon.
On one side, the contraction of the Bollinger bands indicates low volatility, which precedes a breakout. Also, the Stochastic RSI at the bottom of the chart suggests the pair is beginning to gain more momentum, as displayed by the line positioning and crossover.
However, sustained momentum at this pace can see the Ripple above the $0.7000 towards the $0.7500. Conversely, a drop in the price below the upper band may suggest weakening momentum, which may lead to a retest of recent support levels.
XRP/USDT Analysis: A Breakout to Which Side?
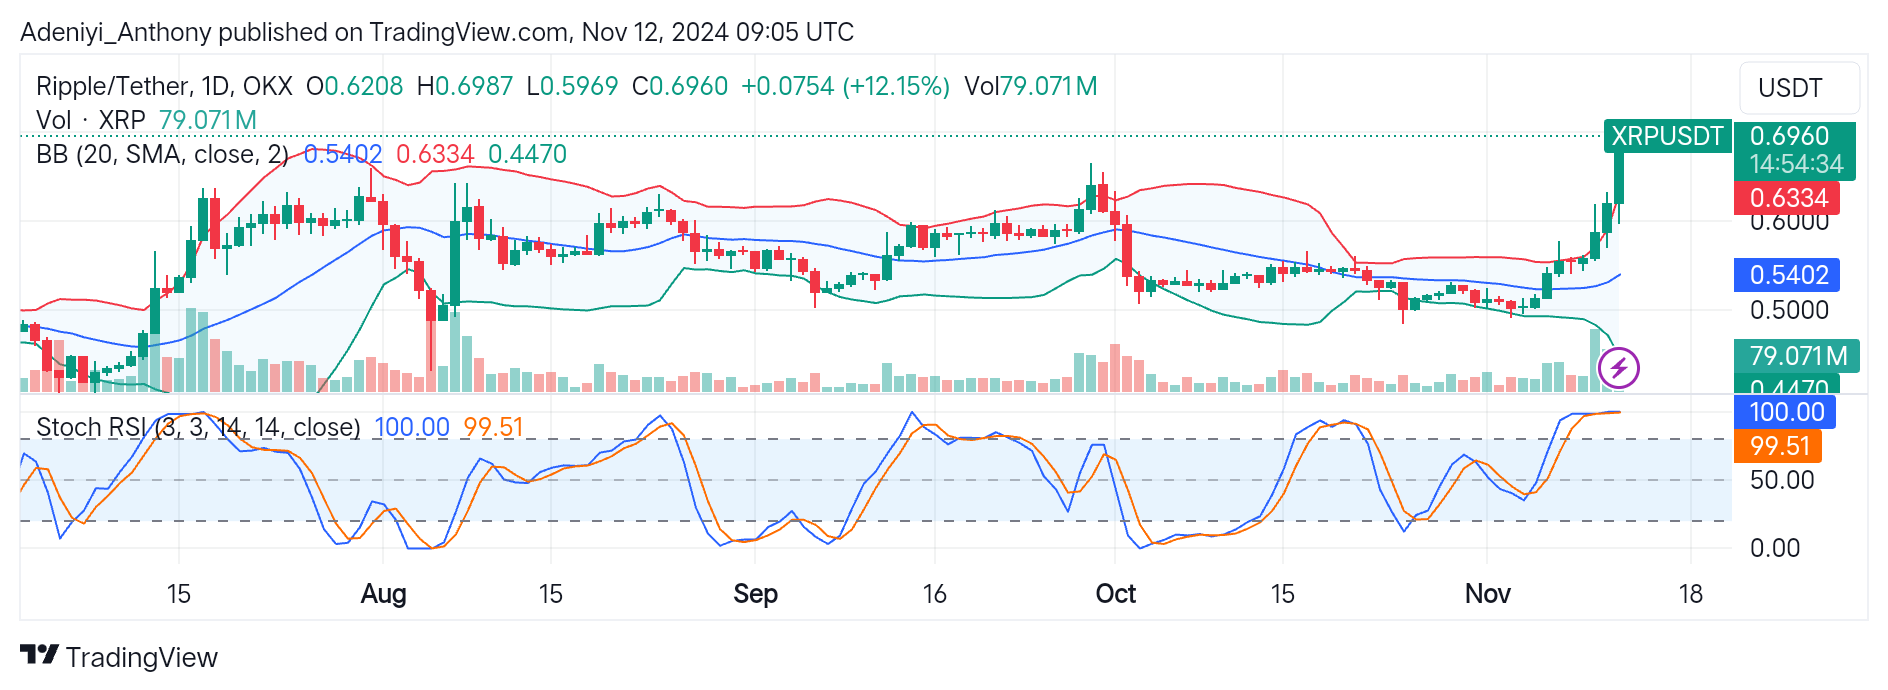
XRP/USDT on a daily timeframe is experiencing upward momentum and is currently trading above the upper Bollinger band at $0.6334. The daily analysis of the pair suggests an overbought condition and the pair may be due for a pullback to accommodate more upside movement in the future, provided bullish traders seize the opportunity.
On the other hand, the Stochastic RSI signals a possible short-term pullback or consolidation as the lines of the indicators extend forward above the 90-mark level.
However, with the indicators on this chart suggesting an overbought condition, a price dip between the $0.6334 and $0.5402 may occur, providing more buying opportunities if the current bullish sentiment persists.
You can purchase crypto coins here. Buy LBlock