Ripple (XRP/USDT) Anticipate a Bullish Reversal
Estimated Reading Time: 3 minutes
Don’t invest unless you’re prepared to lose all the money you invest. This is a high-risk investment and you are unlikely to be protected if something goes wrong. Take 2 minutes to learn more
Ripple Long-term Analysis: Ranging
The ripple (XRP) against the Tether has experienced considerable price fluctuations for some weeks. However, the technical indicators used in this analysis suggest the pair may be hinting at a potential bullish reversal in the coming weeks.
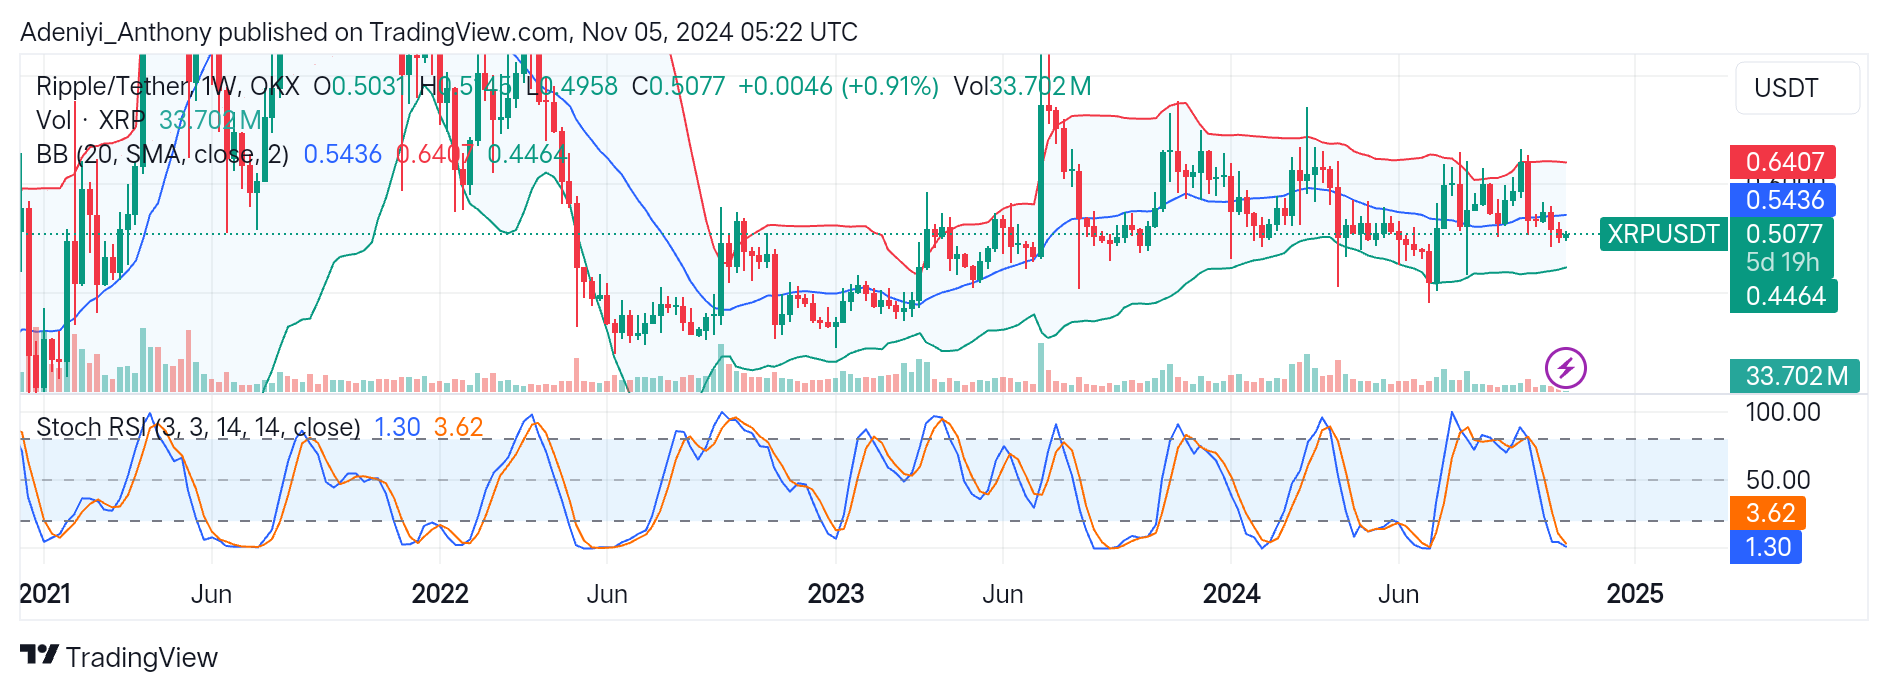
The recent price movement between the lower segment of the Bollinger bands suggests the pair is currently oversold and may be due for an upside movement. Similarly, the Stochastic RSI pictures the pair deep into the oversold zone with the orange and blue lines at 3.62 and 1.30 levels, respectively.
However, XRP/USDT must break above the dynamic mid-band at $0.5436 with an increased volume to confirm this move.
Currently, XRP/USDT trades at $0.5077, with a slight positive difference from the previous session.
Technical Indicators
Major Resistance Levels: $0.5436, $0.6407, and $0.7200
Major Support Levels: $0.4900, $0.4464, and $0.4000
Ripple Technical Analysis
The analysis of the Ripple against USDT on a weekly timeframe shows that the pair has been responding to various fundamental and technical factors. The pair seems to be moving within tightened Bollinger bands while printing short-term gains and losses. However, the price action beneath the mid-band suggests a bullish reversal might be on the horizon due to the formation of the bullish candlestick.
On the downside of the chart, the Stochastic RSI indicates oversold conditions. The positioning of the lines below the 20 levels suggests some bullish momentum may be building as the pair operates too deep in the oversold region. To this end, a break above the mid-band at $0.5436 with a spike in trading volume and a full-line crossover will cement this move. In the meantime, prices may consolidate within this range if the conditions are not met.
XRP/USDT Analysis: A Bullish Reversal or a Continued Downtrend
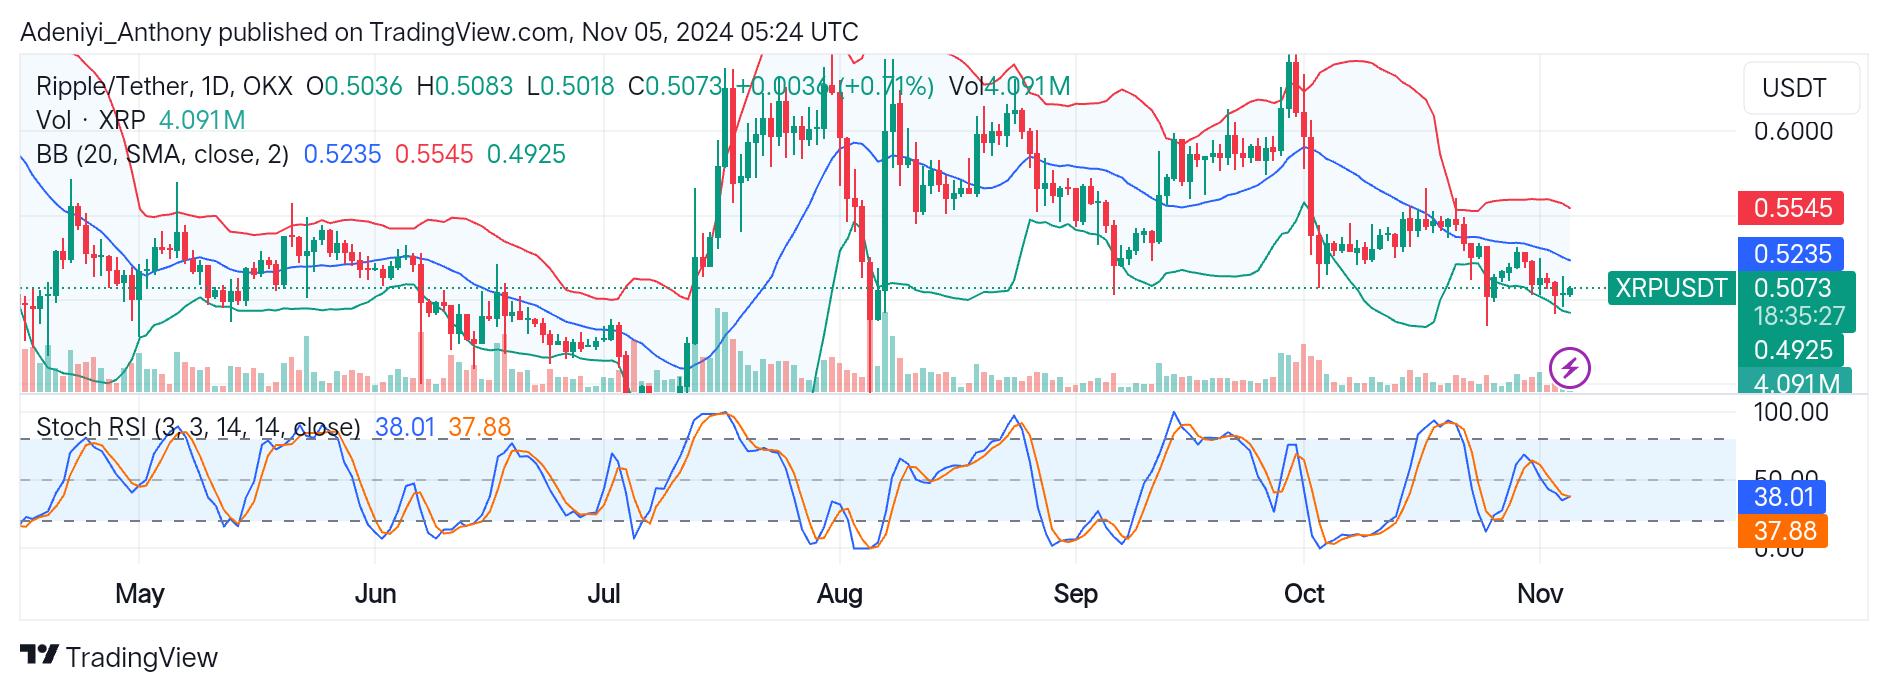
On a daily timeframe, XRP/USDT has been trading at $0.5073 under the middle band. This captures the activities of the bearish traders. However, the current bullish uptick around the lower band at $0.4925 suggests the pair is beginning to gain momentum and may retest the $0.5235 level soon.
The Stochastic RSI at the bottom of the chart suggests weak momentum due to the positioning of the lines. Therefore, for a bullish reversal, traders must watch out for the $0.5235 level. Otherwise, a spike in volume without the required bullish pressure will cause the price to oscillate at this level before any price dip.
You can purchase crypto coins here. Buy LBlock

