Arbitrum (ARB) Struggles to Find Direction: Downtrend Meets Potential Oversold Signal
Estimated Reading Time: 2 minutes
Don’t invest unless you’re prepared to lose all the money you invest. This is a high-risk investment and you are unlikely to be protected if something goes wrong. Take 2 minutes to learn more
Arbitrum (ARB/USD) Price Analysis – June 11
Arbitrum (ARB) trades at $0.9350 at the time of writing. For more than 24 hours, 195,713,159 ARB coins have been exchanged, bringing about a trading volume of $183,000,518. At this period, the price has decreased by 2.80%, positioning ARB 2.59% lower than its opening price of $0.9599.
During the last 30 days, the price has dropped by 26.53% from its maximum, and by 17.65% from its peak over the last 7 days. From the minimum recorded prices in these periods, the price has increased by only 1.01% over 30 days and has fallen by 0.43% over 7 days.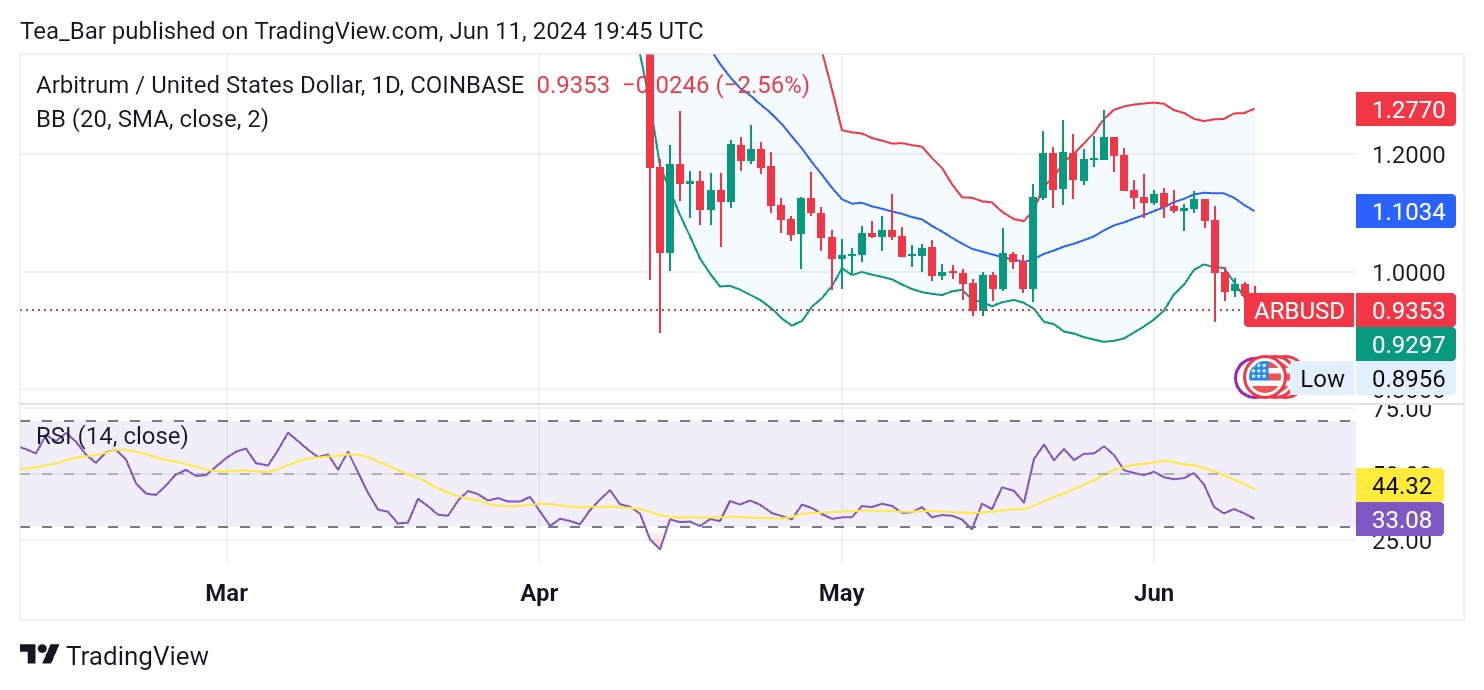
Daily Chart Analysis
The current ARB price of $0.9350 is below the middle Bollinger Band of $1.1034, suggesting it is closer to the lower band of $0.9297. The narrow range between the upper and lower bands on the daily chart indicates low volatility, implying that price movements have been relatively contained within a specific range.
An RSI of 33 places ARB near the oversold threshold, hinting that the asset might be undervalued and could see a reversal if buying interest picks up.
4-Hour Chart Analysis
On the 4-hour timeframe, ARB’s price of $0.9350 is also near the lower Bollinger Band of $0.9288 and close to the middle band of $0.9607. This indicates a relatively stable position within the Bollinger Bands on this shorter timeframe compared to the daily chart. 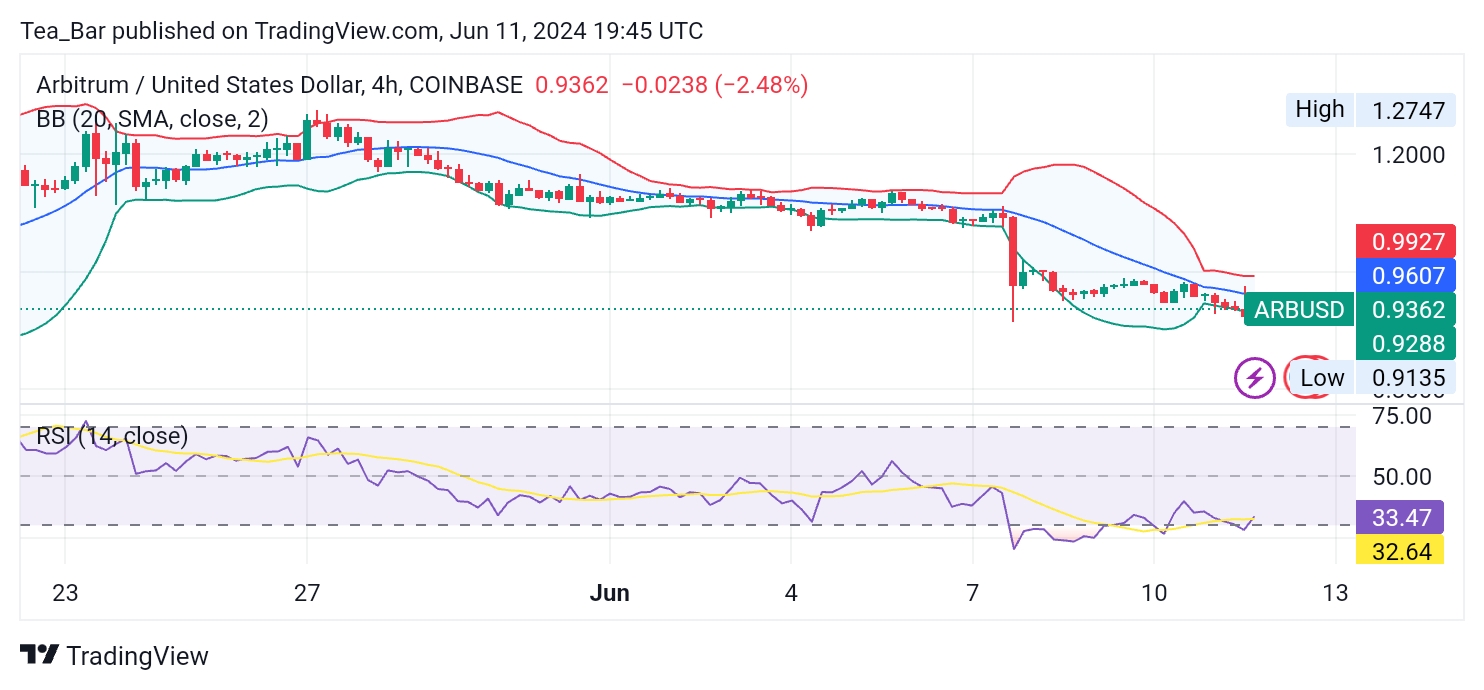
The proximity to the lower band, combined with an RSI of 33, signals a potential oversold condition on this shorter timeframe as well.
Conclusion
Considering the broader downward trend observed over the past 30 and 7 days, traders might be cautious about entering new long positions without further confirmation of a reversal.
The proximity to the lower Bollinger Bands on both the daily and 4-hour charts and the relatively low RSI might attract buyers seeking potential short-term gains. However, the neutrality on the 4-hour chart suggests that the market could remain range-bound in the short term, awaiting a clearer directional move.
Place winning Arbitrum trades with us. Get ARB here.