Arbitrum (ARB) Technical Analysis: A Potential Price Reversal in Sight
Estimated Reading Time: 2 minutes
Don’t invest unless you’re prepared to lose all the money you invest. This is a high-risk investment and you are unlikely to be protected if something goes wrong. Take 2 minutes to learn more
Arbitrum (ARB) Price Analysis: June 7, 2024
Arbitrum (ARB) has captured the attention of traders and investors alike with its recent price movements. In this technical analysis, we will dissect the performance of ARB by examining both its daily and 4-hour charts, providing valuable insights into potential price trends.
Daily Chart Analysis
Delving into the daily chart, we witness a significant decline in ARB’s price, opening at $1.09 and subsequently plummeting by -10.02% to its current price of $0.9804. Despite attempts to breach the $1.10 mark, ARB encountered formidable resistance, indicative of robust selling pressure. 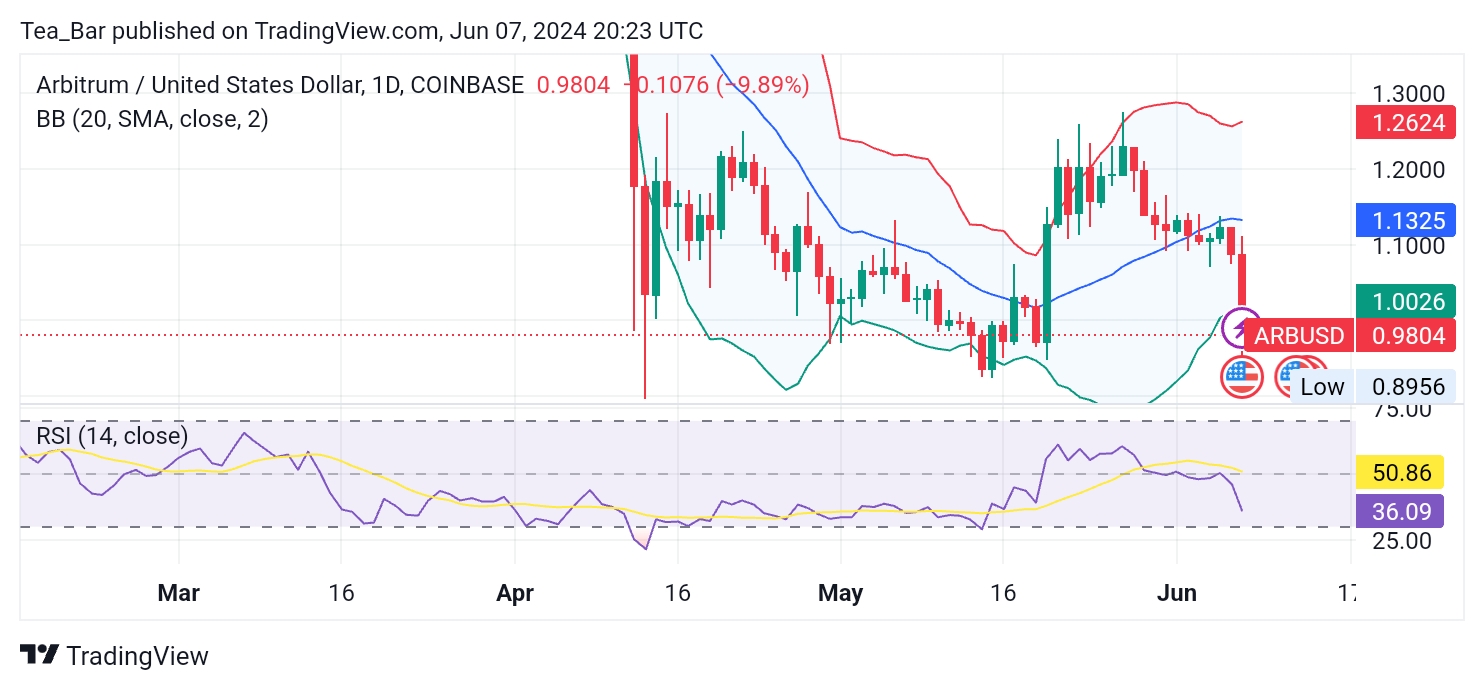
Notably, the Bollinger Bands on the daily chart indicate that ARB is edging closer to the lower band, situated at $1.0026, hinting at a potential price correction.
Additionally, with the Relative Strength Index (RSI) hovering at 36, ARB appears to be nearing oversold conditions, possibly signaling an impending reversal.
4-Hour Chart Analysis
Zooming in on the 4-hour chart, we uncover further insights into ARB’s price dynamics. Trading in proximity to the lower Bollinger Band, currently positioned at $1.0131, ARB reflects oversold conditions in the short term.
The Relative Strength Index (RSI) stands at 20, underscoring the extent of oversold territory, often preceding a corrective bounce or stabilization. This suggests the potential for a short-term price rebound in ARB’s trajectory.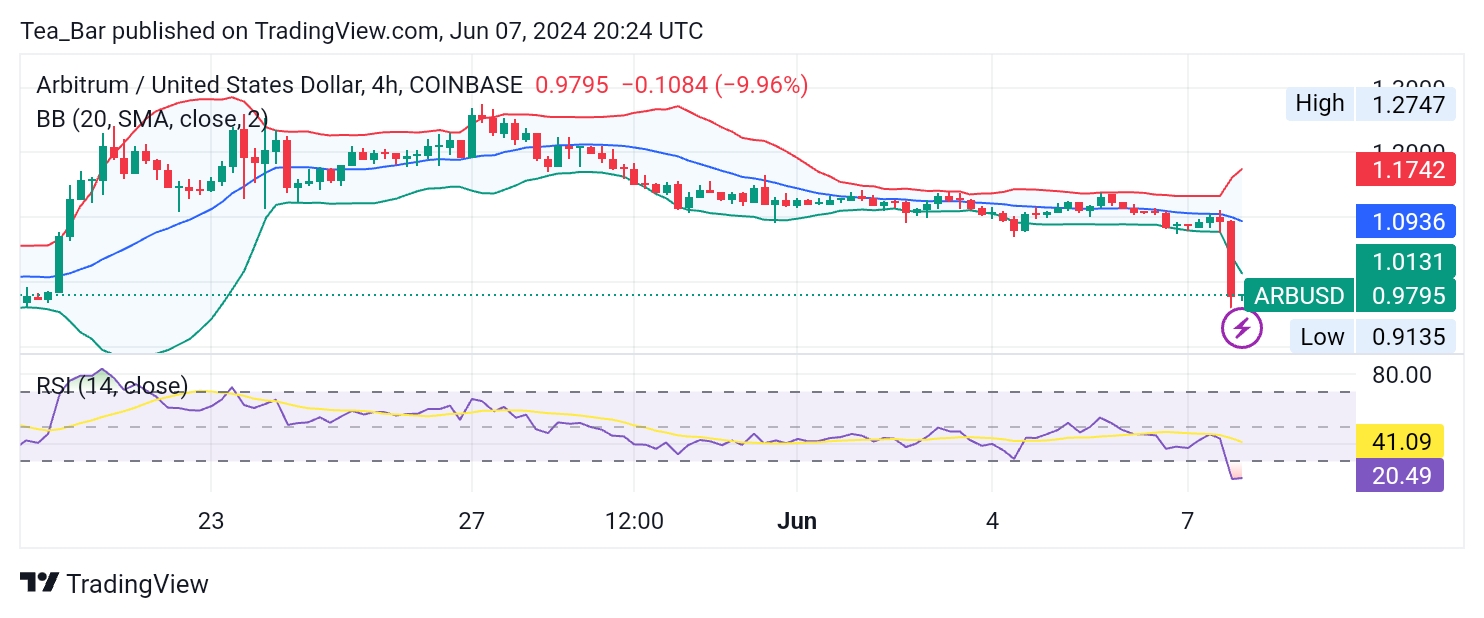
Conclusion
Given the technical indicators and recent price movements, a short-term price rebound in Arbitrum (ARB) seems plausible. The oversold conditions delineated by both the daily and 4-hour charts, coupled with the RSI’s indication of a potential corrective bounce, underscore the likelihood of a price recovery in the near future.
However, it’s imperative to acknowledge the robust resistance at the $1.10 level and the overarching downtrend.
Place winning Arbitrum trades with us. Get ARB here.