Arbitrum (ARB) Faces Price Decline: Will a Reversal Occur?
Estimated Reading Time: 3 minutes
Don’t invest unless you’re prepared to lose all the money you invest. This is a high-risk investment and you are unlikely to be protected if something goes wrong. Take 2 minutes to learn more
Arbitrum (ARB) Price Analysis – May 28
Arbitrum (ARB) is priced at $1.20, with a trading volume of $251,748,847 over the last 24 hours. During this period, 210,163,166 ARB coins were exchanged, marking a decrease of -2.80% in price.
Today commenced with Arbitrum (ARB) opening at $1.23. However, the current price reflects a decline of -2.38% from the opening rate. Over the past 30 days, the coin’s value has experienced a downturn of -5.88%.
Nonetheless, within the same timeframe, it has surged by 29.40% from the minimum recorded price and by 7.77% from the minimum price in the last seven days.
1-Day Chart Analysis
Arbitrum (ARB) exhibits a 1-day Relative Strength Index (RSI) of 57, indicating moderate strength in the market. While above the oversold threshold of 30, the RSI suggests potential for further price movement.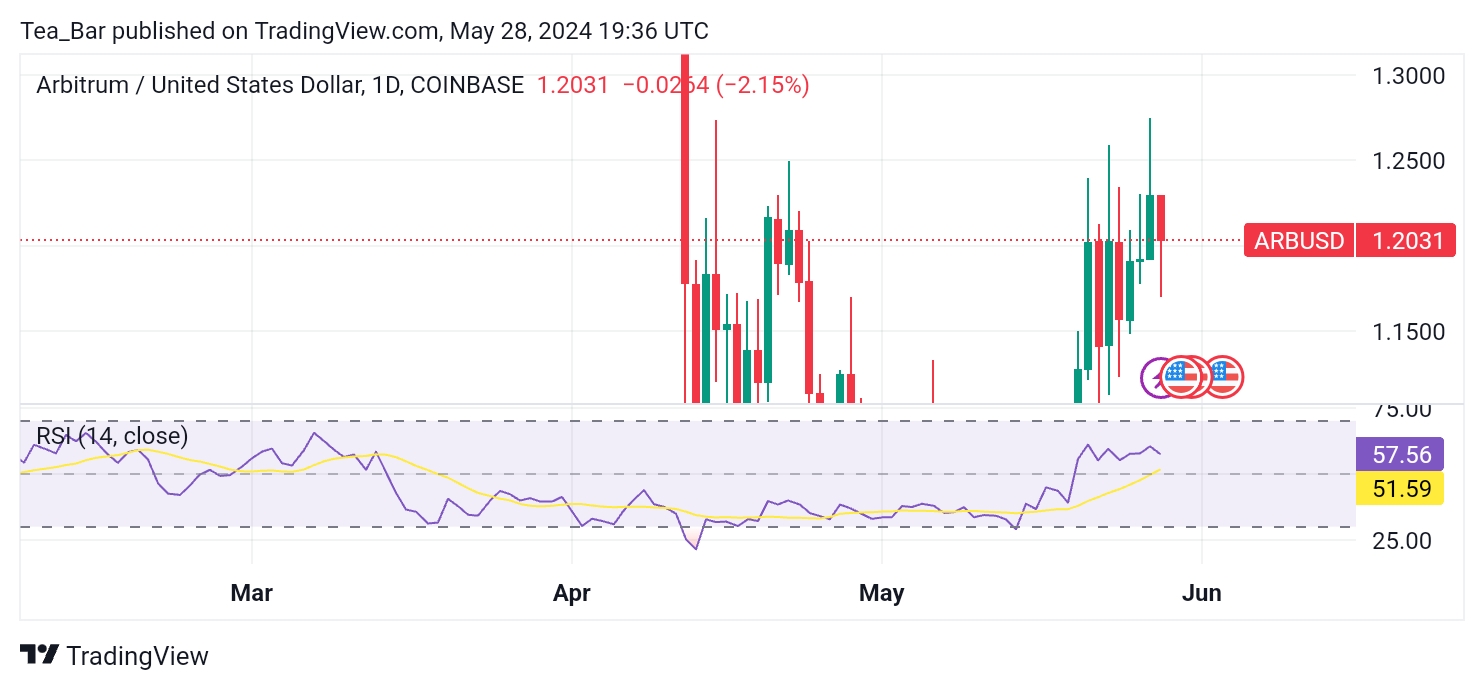
Resistance Levels: $1.25, $1.30, $1.35
Support Levels: $1.15, $1.10, $1.05
Arbitrum (ARB) faces resistance at $1.25, $1.30, and $1.35, representing crucial price barriers. Conversely, support levels at $1.15, $1.10, and $1.05 act as key zones where buying interest may emerge, preventing further decline.
These levels play a significant role in shaping ARB’s price trajectory and guiding trading strategies.
4-Hour Chart Analysis
On the 4-hour chart, ARB’s RSI stands at 49, signaling a balanced market sentiment. This suggests that the coin may be at a pivotal point, with potential for either further decline or a reversal in trend. 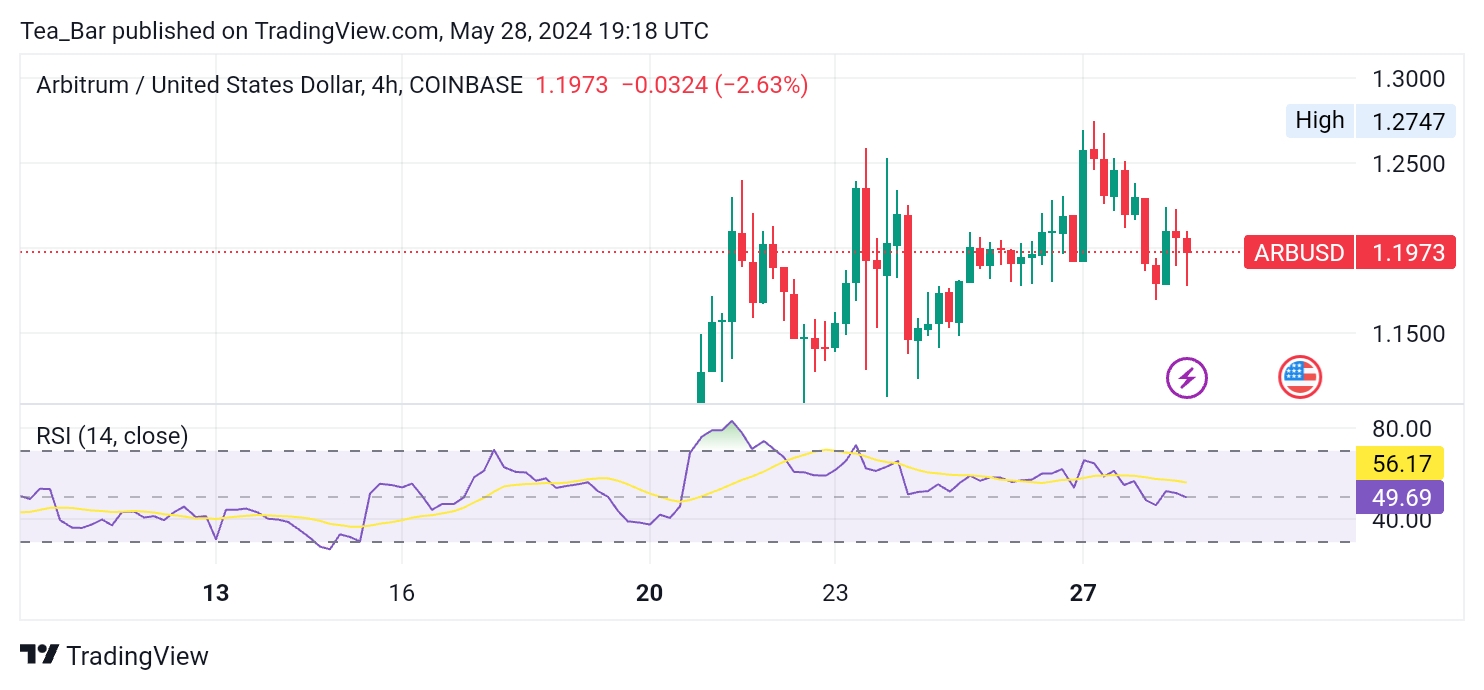
Investors will closely monitor these RSI levels, as they often provide valuable insights into market sentiment and potential price movements.
Conclusion
Arbitrum (ARB) has encountered a downward trend, with prices experiencing a decline over the past 24 hours. Despite this, the coin has shown resilience over the longer term, with notable increases from recent minimum prices. Technical indicators from both the 1-day and 4-hour charts suggest that ARB is currently at a critical juncture.
Meanwhile, global stock markets saw modest declines. Investors will likely monitor Arbitrum’s price movements closely this week, especially as it approaches key support and resistance levels. External factors such as overall market sentiment and regulatory developments may also influence ARB’s performance.
Place winning Arbitrum trades with us. Get ARB here.