Arbitrum (ARB) Soars 19.30%: Bullish Trend Intensifies
Estimated Reading Time: 3 minutes
Don’t invest unless you’re prepared to lose all the money you invest. This is a high-risk investment and you are unlikely to be protected if something goes wrong. Take 2 minutes to learn more
Arbitrum (ARB) Price Prediction – May 21
Arbitrum (ARB) has emerged as a dynamic player in the cryptocurrency arena, captivating investors with its remarkable price movements. Today, ARB stands tall at $1.18, showcasing an impressive surge of 19.30% over the past 24 hours.
The trading volume has been robust, with 630,291,149 ARB coins changing hands, reflecting a staggering transaction value of $746,559,282. Bolstered by a circulating supply of 1 billion coins, Arbitrum solidifies its position at #58 in market capitalization, boasting a substantial total market cap of $2 billion.
ARB commenced its trading journey today at $1.14, witnessing a notable climb of 4.16% from the opening price. Despite a momentary dip to $1.12, ARB has displayed resilience, swiftly rebounding and forging ahead. Over the preceding 30 days,
ARB experienced a marginal -4.35% decline from its peak; however, it staged an impressive recovery with a 5.16% upturn over the past 7 days. Noteworthy is ARB’s substantial surge of 27.95% from its recorded minimum price within the same timeframe, underscoring its potential for significant gains.
ARB/USD Long-Term Trend: Bullish (Daily Chart)
Key Levels:
Resistance: $1.20, $1.25, $1.30
Support: $1.15, $1.10, $1.05
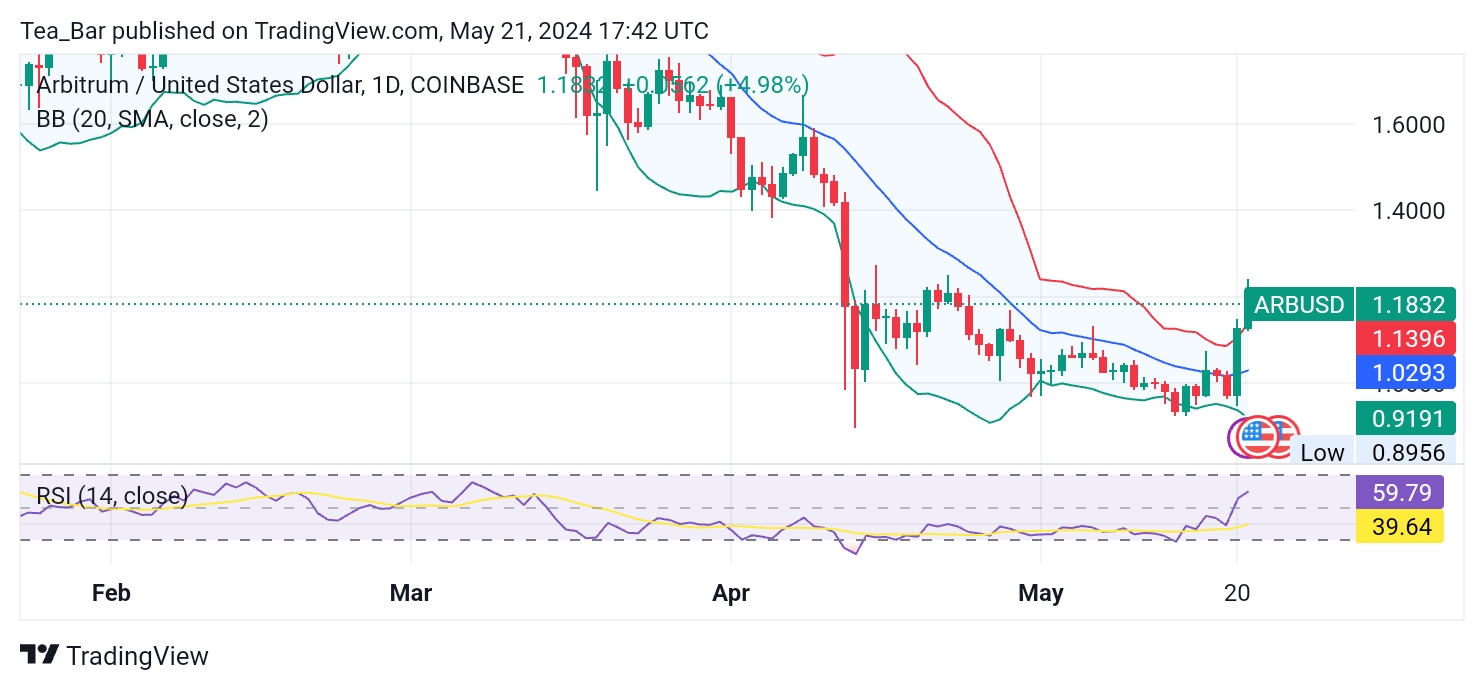
The daily chart paints a picture of strength and resilience for ARB. The price hovers near the upper Bollinger Band at $1.1396, signaling strong bullish momentum. The middle band at $1.0293 and the lower band at $0.9191 provide additional support levels.
With an RSI of 59, ARB reflects a strong market sentiment, suggesting potential for further upward movement. The RSI’s position below the overbought threshold indicates room for continued growth without immediate risk of a correction.
ARB/USD Medium-Term Trend: Bullish (4H Chart)
The 4-hour chart provides deeper insights into ARB’s shorter-term price dynamics. ARB trades above the middle Bollinger Band at $1.0512, with the upper band at $1.2178 and the lower band at $0.8846.
This positioning indicates intensified bullish momentum in the shorter term, with potential for continued upward movement. 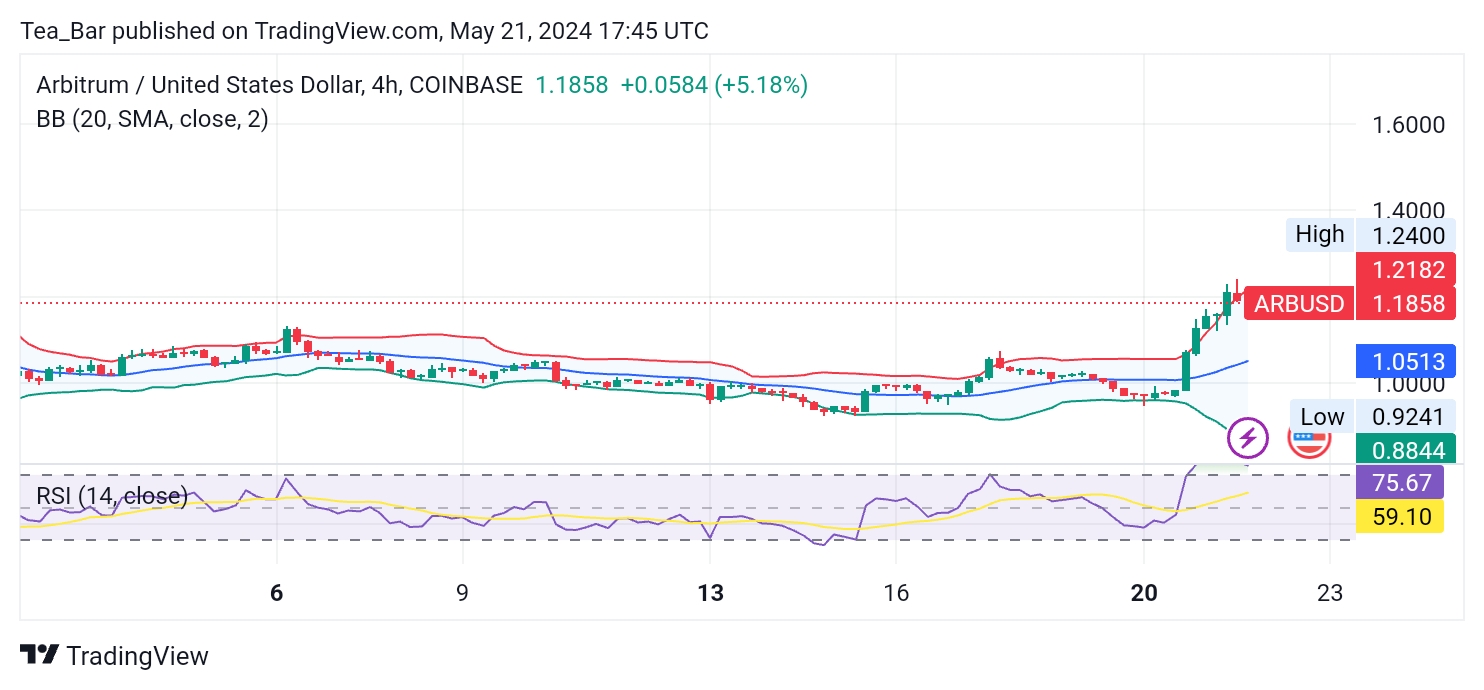
The 4-hour chart’s RSI of 75 suggests overbought conditions, highlighting the possibility of a short-term correction. However, the strength of ARB’s upward trend is underscored by the RSI’s elevated level, indicating strong buying pressure.
Conclusion
Arbitrum (ARB) showcases robust performance across both the daily and 4-hour charts, underpinned by its significant price surge and robust trading volume. The daily chart reflects a bullish trend, with ARB positioned near the upper Bollinger Band and supported by a positive RSI of 59.
Meanwhile, the 4-hour chart amplifies this bullish sentiment, although caution is warranted due to overbought conditions indicated by an RSI of 75.
Place winning Arbitrum trades with us. Get ARB here.