Will Arbitrum (ARB) Surpass Resistance and Initiate a Price Recovery?
Estimated Reading Time: 3 minutes
Don’t invest unless you’re prepared to lose all the money you invest. This is a high-risk investment and you are unlikely to be protected if something goes wrong. Take 2 minutes to learn more
Arbitrum (ARB) Price Prediction – May 14
Arbitrum (ARB) is currently undergoing intricate price dynamics as the cryptocurrency market continues to fluctuate. At the time of writing, ARB opened the day at $0.9804 and is currently trading at $0.9586, marking a -2.26% decrease from its opening price.
Despite briefly touching $0.9876, ARB faced resistance, impeding sustained upward momentum.The past 24 hours have seen ARB experience a -3.32% decline, reflecting the prevailing short-term bearish sentiment in the cryptocurrency market.
Over the last 30 and 7 days, ARB has witnessed substantial declines, with a -24.38% and -10.99% decrease respectively from the maximum price levels. However, a slight 0.28% increase was observed from the minimum recorded price during the same period.
Key levels:
Resistance: $0.9876, $1.0000, $1.1000
Support: $0.9500, $0.9400, $0.9300
The immediate resistance for ARB is evident around the $0.9876 level, where significant selling pressure was observed earlier. This resistance level may persist and strengthen as ARB attempts to break through recent highs.
Conversely, support levels are identified at $0.9500, $0.9400, and $0.9300, providing a foundation for potential price rebounds.
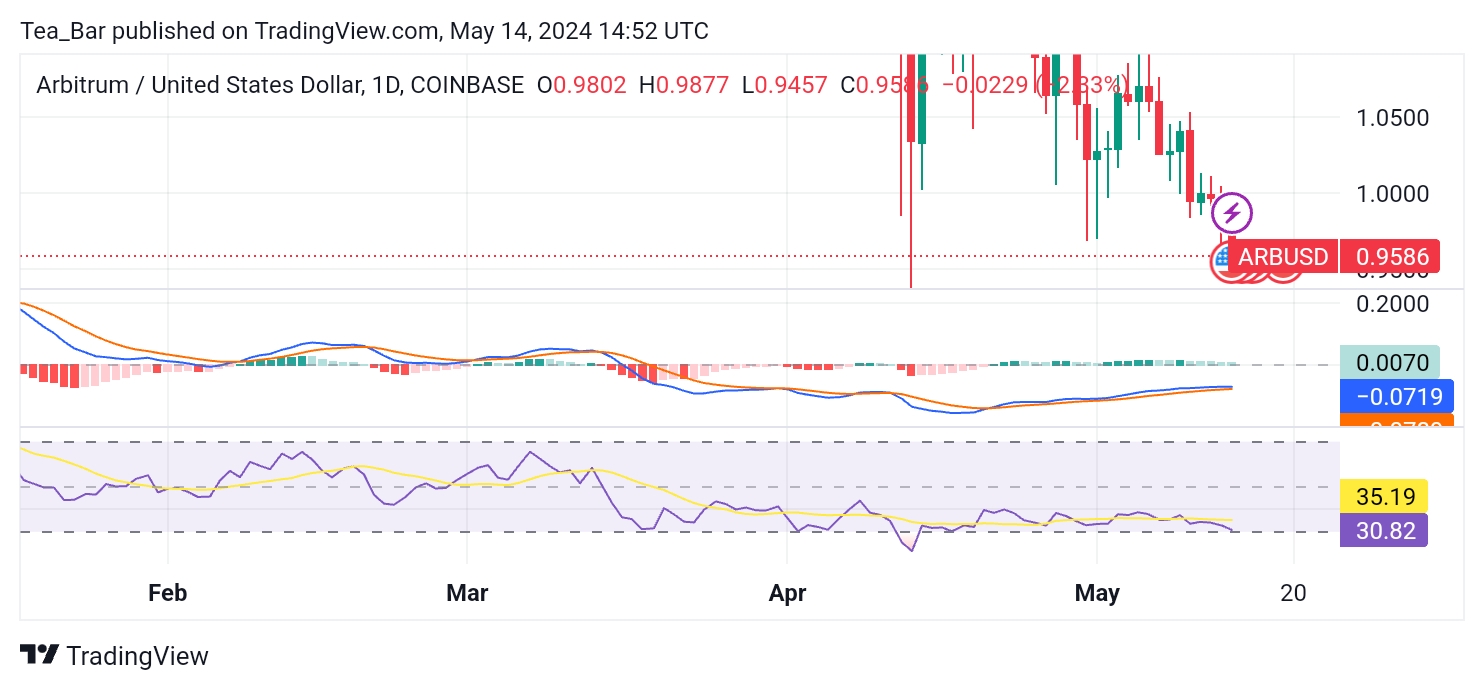 ARB/USD Long-term Trend: Bearish (Daily Chart)
On the 1-day chart, ARB’s Relative Strength Index (RSI) stands at 30.82, indicating potential proximity to oversold conditions. While this suggests possible buying opportunities, it also signifies a bearish sentiment prevailing in the market.
The Moving Average Convergence Divergence (MACD) remains below the zero line at -0.0719, indicating a continuation of the bearish trend. However, the slight uptick in RSI from oversold levels could signal a potential reversal in the short term.
ARBUSD Medium-Term Trend: Bearish (4H Chart)
Zooming in on the 4-hour chart, ARB’s RSI is slightly higher at 32.89, suggesting continued bearish sentiment in the short term. Similarly, the MACD persists below the zero line, reinforcing the prevailing bearish outlook. 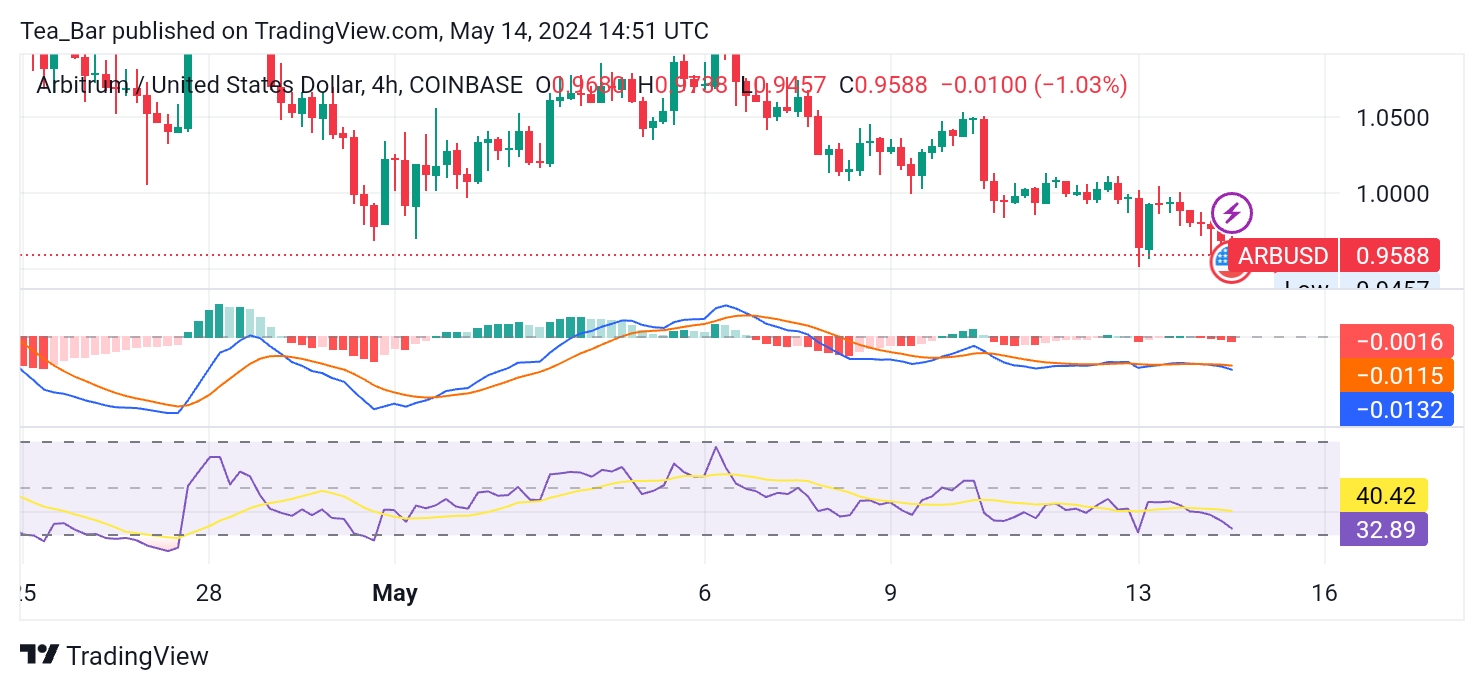
However, the RSI’s movement towards neutral territory and potential convergence with the MACD signal line may indicate a weakening bearish momentum, potentially paving the way for a price reversal or stabilization.
Conclusion
Despite encountering resistance and facing bearish trends in the short term, ARB maintains potential for positive price movement. With identified support levels in place and technical indicators showing signs of potential reversals, there are reasons for cautious optimism regarding ARB’s future performance.
As market conditions evolve, it’s crucial to remain vigilant and consider additional factors impacting ARB’s price trajectory.
Place winning Arbitrum trades with us. Get ARB here.