Solana (SOL/USD) Price Contemplates to Rebuild a Baseline at $20
Estimated Reading Time: 3 minutes
Don’t invest unless you’re prepared to lose all the money you invest. This is a high-risk investment and you are unlikely to be protected if something goes wrong. Take 2 minutes to learn more
Solana Price Prediction – January 20
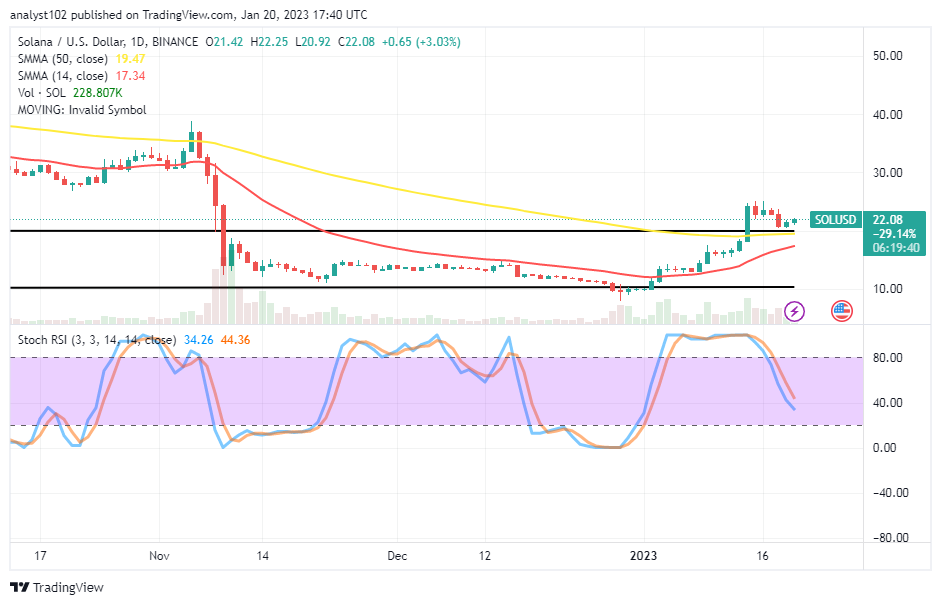
About a week ago, the SOL/USD market surged northward higher to test resistance around the $25 line before contemplating rebuilding a baseline around the $20 sequence to a correction. Currently, the crypto economy trades around $22.08 at an average percentage rate of 3.03 positive. Some ups are managing to crop up near the point in question.
SOL/USD Market
Key Levels:
Resistance levels: $25, $27.50, $30
Support levels: $17.50, $15, $12.50
SOL/USD – Daily Chart
The daily chart reveals that the SOL/USD market price contemplates rebuilding a baseline around the $20 level. The 50-day SMA indicator is at $19.47 point, closely aligning within the upper horizontal line over the 14-day SMA indicator, which is at the $17.34 value line. The Stochastic Oscillators have traveled southbound from the overbought region to touch 44.36 and 34.26 levels. But, they are somewhat trying to curve northward back at those value levels.
Will the SOL/USD 14th-day bullish candlestick lose its strength path back into a series of fall-offs?
If the $20 level breaches southward to the extent of aiming to touch the point of the smaller SMA trend line, the subsequent sessions may run into a series of fall-offs. The SOL/USD market valuation is contemplating rebuilding a baseline around the value line. Based upon that, the velocity to push upside has featured carrying a low-weight move, making a longing entry not firmly enough to rely on at the time of writing.
On the downside of the technical analysis, the path point to reclaim a reliable sorting order entry has been built closely beneath the $30 resistance level. Sellers would have to adhere to the reading outlook of the Stochastic Oscillators at higher levels to signify a return of a declining motion afterward. A sudden occurrence of a bearish candlestick forming to break the point of the 50-day SMA, on the other hand, may trigger some decreases to the lower-trading points below the 14-day SMA trend line.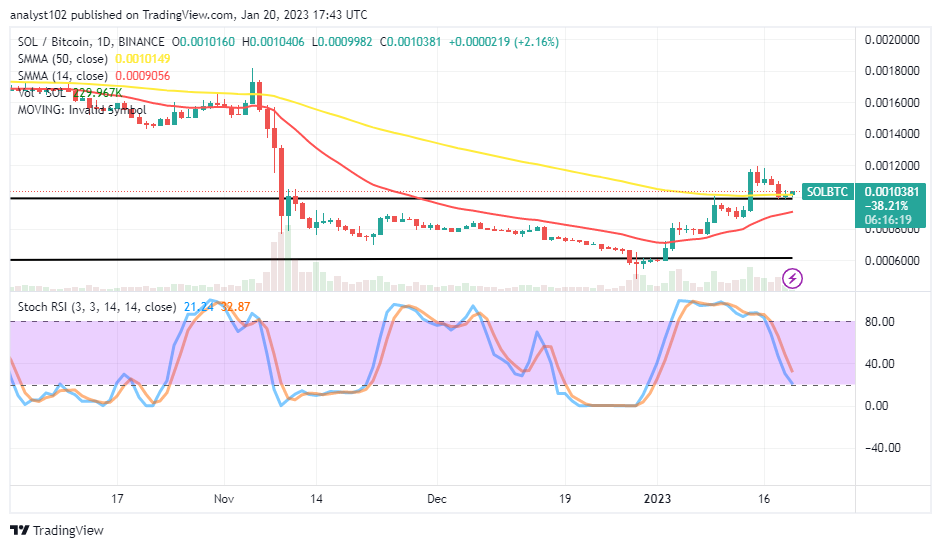
SOL/BTC Price Analysis
Today’s comparison outlook Solana has shifted stances to the south side against the trending capacity of Bitcoin after hitting a resistance over the indicators to rebuild a baseline around the conjoined area of the upper range line and the 50-day SMA indicator. The 14-day SMA indicator has curved northward below the 50-day SMA indicator. The Stochastic Oscillators have crossed southbound, attempting to bend slightly northbound at 21.24 and 32.87 levels, indicating that an upward force is there relative to the dual cryptos at the time of writing.
Note: Cryptosignals.org is not a financial advisor. Do your research before investing your funds in any financial asset or presented product or event. We are not responsible for your investing results.
You can purchase Lucky Block here. Buy LBLOCK