Bitcoin (BTC/USD) Market Wavers, Keeping in $30,000 and $32,000
Estimated Reading Time: 3 minutes
Don’t invest unless you’re prepared to lose all the money you invest. This is a high-risk investment and you are unlikely to be protected if something goes wrong. Take 2 minutes to learn more
Bitcoin Price Prediction – July 5
The Bitcoin market operation wavers, keeping in the value lines of $30000 and $32,000, as it has been showcased that bullish price movements are gaining a topnotch out of other directions presently.
In the technicalities of nurturing that sentiment, long-position takers should have to remain firmly against any downward reversal motion that can breach forcibly past the logical support line of $30,000 in the long run. In this piece, the price is maintaining a maximal value of $30,938.51 and a minimal point of $30,843.15 at a minute 0.15% positive.
BTC/USD Market
Key Levels:
Resistance levels: $32,000, $33,000, $34,000
Support levels: $29,000, $28,000, $27,000
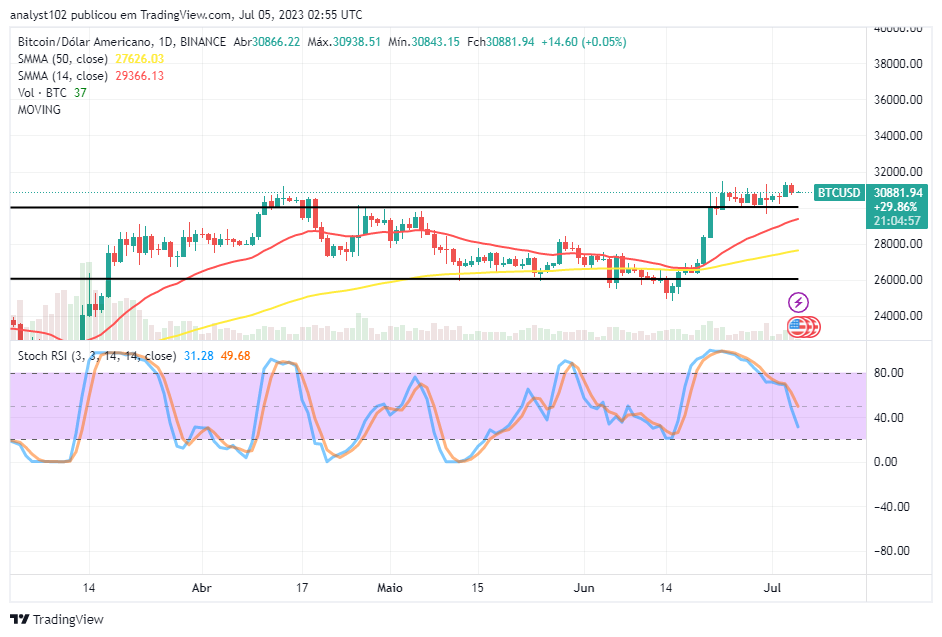
BTC/USD – Daily Chart
The BTC/USD daily chart showcases that the crypto-economic market wavers, keeping within the $30,000 and $32,000 value lines.
The 50-day SMA indicator is at $27,626.03, below the $29,366.13 point of the 14-day SMA indicator. A series of higher lows has piled up to indicate a convergence session is ongoing beneath the resistance line of $32,000. The Stochastic Oscillators have crossed southbound in a slanting order from the overbought region to positions from 49.68 to 31.28 levels. A moment of southward shifts is relatively surfacing at this point.
What could be a good signal for sellers to negate the buy propensity in the current BTC/USD trade?
A fearful formation of a bearish trading candlestick against the upper range line of $30,000 alongside the smaller SMA trending around the value line will potentially give a path wall to seeing subsequent sessions coming in lows as the BTC/USD market is wavering, keeping within the $32,000 and $30,000.
In a nutshell, long-position takers as well as investors have to abide by the reading posture of the Stochastic Oscillators to portend other directions pointing back to the upside with price action to launch a buying order.
On the downside of the technical analysis, bears needed to hold back their presence from further decimation by standing against the possibility of bulls pulling up the market trade level above the resistance of $32,000. That said, there has been a move showcasing a drop. And sellers are to consolidate on it to achieve the able cycle of breaching the psychological point of $30,000.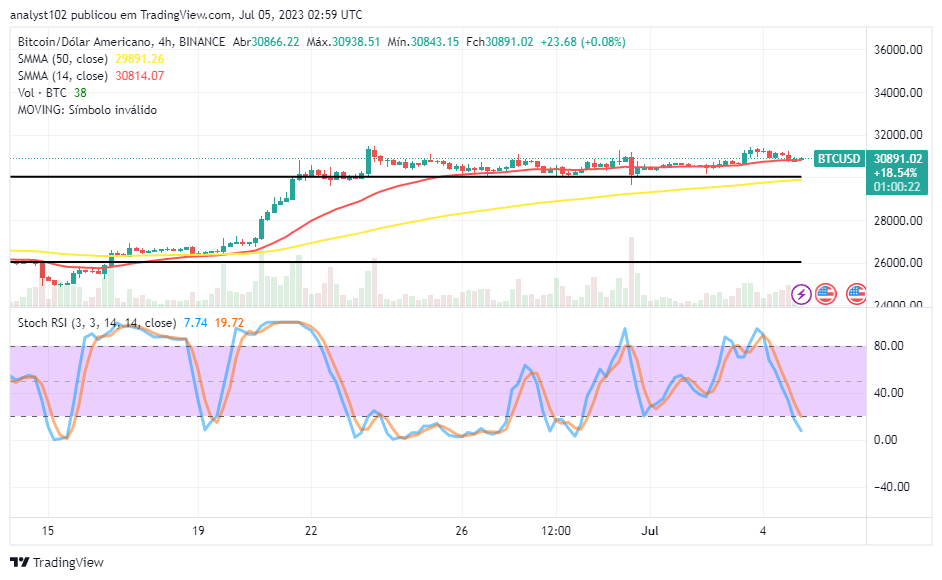
BTC/USD 4-hour Chart
The BTC/USD medium-term chart reveals that the crypto market wavers, keeping within the $32,000 and $30,000 value lines.
The 14-day SMA indicator is at $30,814.07, above the $29,891.26 point of the 50-day SMA indicator. Variant 4-hour candlesticks have formed low-weighed debasing candlesticks around the smaller Moving Average’s point. The Stochastic Oscillators have been positioned southbound from the overbought region from 19.72 to 7.74. It appears a reduction motion is yet to come.
Note: Cryptosignals.org is not a financial advisor. Do your research before investing your funds in any financial asset or presented product or event. We are not responsible for your investing results.
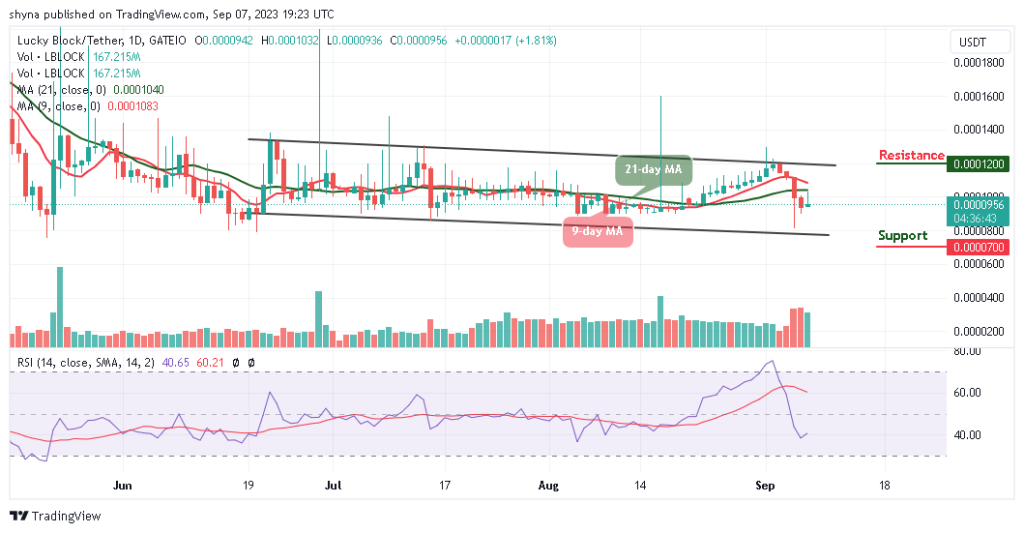
You can purchase Lucky Block here. Buy LBLOCK