Ripple (XRP/USDT) Poises for Decisive Breakout
Estimated Reading Time: 3 minutes
Don’t invest unless you’re prepared to lose all the money you invest. This is a high-risk investment and you are unlikely to be protected if something goes wrong. Take 2 minutes to learn more
Ripple Long-term Analysis: Bearish
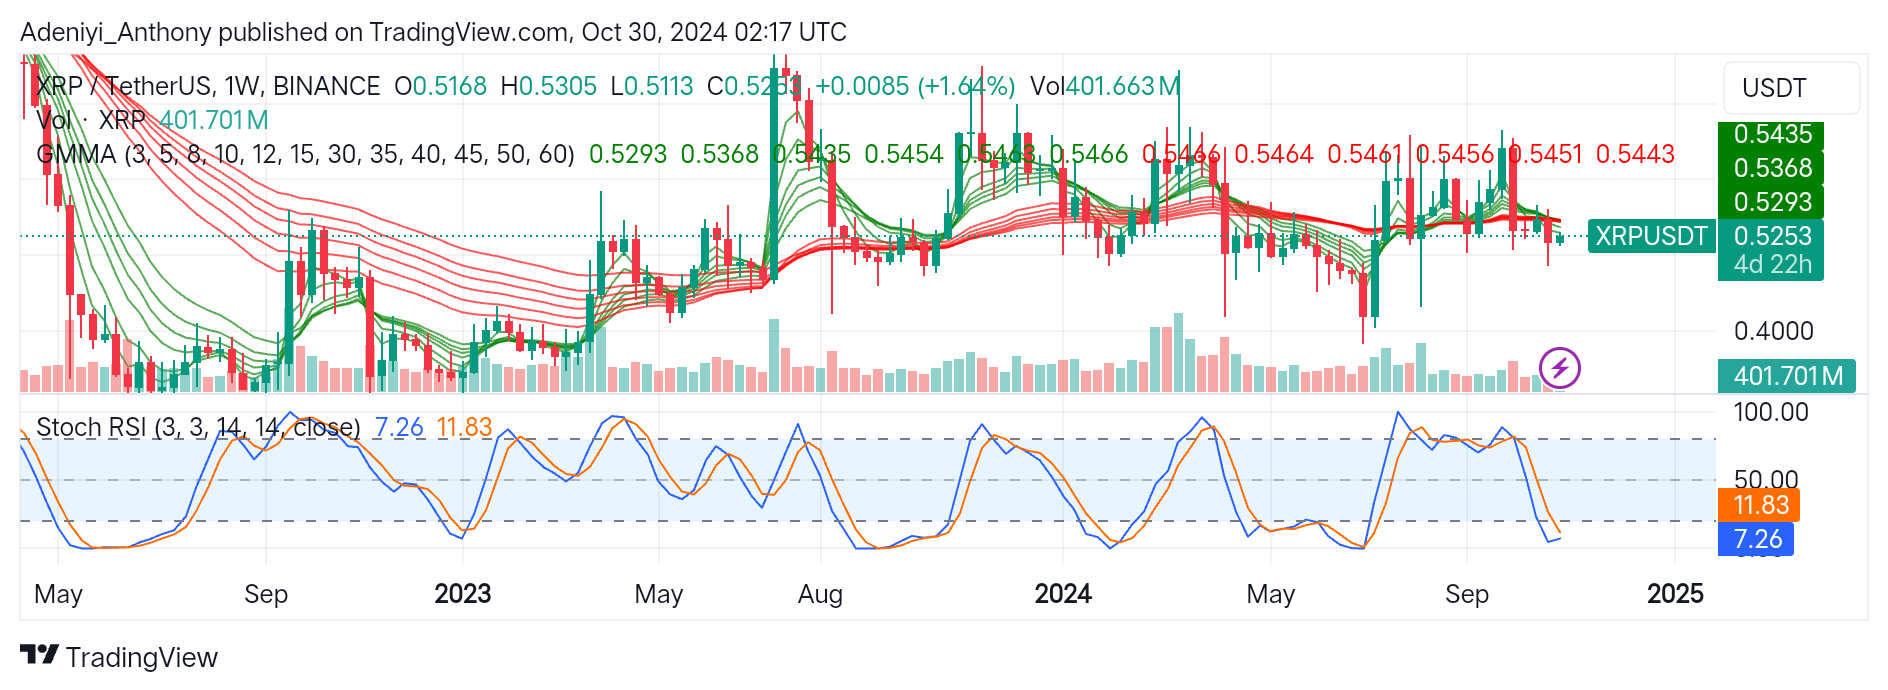
The Ripple against the Tether is in a consolidation phase with a bearish general outlook, as seen in the positioning of the candlestick beneath the short-term multiple averages. The pair has been ranging within a tight range before ticking to the south. However, the Stochastic oscillator suggests a decisive breakout is on the horizon, but subjected to the breaking of key levels.
The Guppy Multiple Moving Averages (GMMA) are relatively compressed, suggesting indecision in the market as buyers and sellers struggle for market dominance. XRP/USDT operates within the $0.5113 and $0.5284 levels. However, the recent crossover of the GMMA may suggest the continuation of the long-term bearish sentiment; a break above or below the $0.5451 level will confirm an upside breakout.
The price of XRP at the time of writing is $0.5253, with a 1.64% positive difference from last session.
XRP/USDT Technical Indicator
Major Resistance Levels: $0.5284, $0.5451, and $0.5646
Major Support Levels: $0.5230, $0.5113, and $0.5000
Ripple Technical Analysis
The analysis of Ripple against the Tether reveals that the pair has been consolidating for a long time with a bearish undertone. However, the relatively compressed GMMA suggests the pair awaits a decisive breakout in either direction as traders struggle for market dominance.
On the other hand, the Stochastic RSI suggests the pair is in the oversold region and a short-term reversal to the North is around the corner. However, for a bullish breakout, the price needs to break above $0.5451 for confirmation; otherwise, a break below $0.5230 will confirm a bearish breakout.
XRP/USDT Analysis: What to Expect
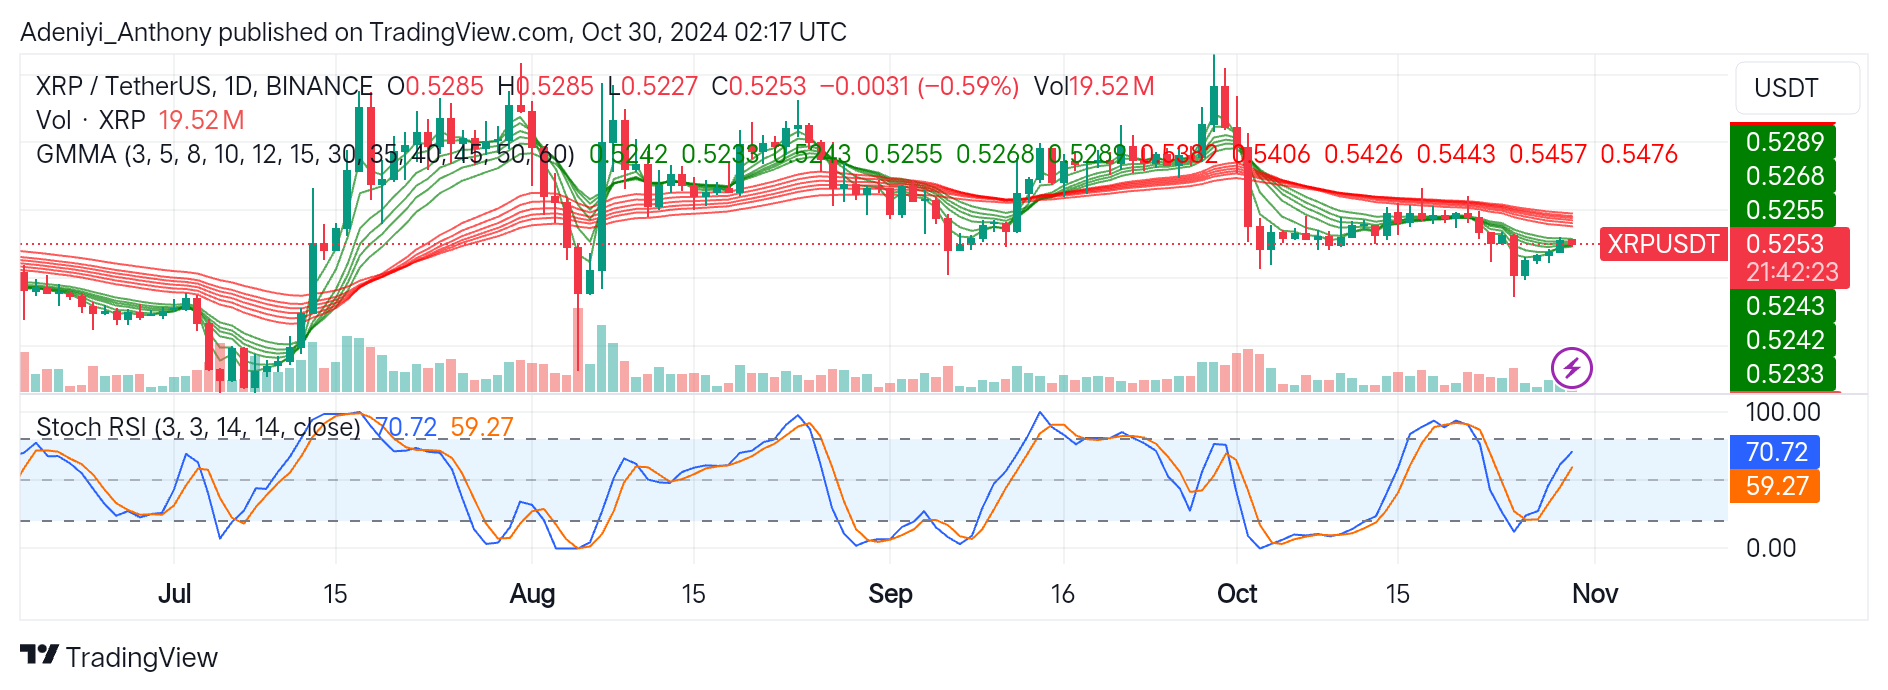
XRP/USDT on the daily timeframe shows signs of short-term bullish momentum under the flattening short-term averages, indicating the end of the current downtrend and potential reversal. However, the current bullish pressure lacks strong conviction, and for the confirmation of reversal, the price needs to break above the $0.5288 level with the crossover of the set of averages.
On the downside of the chart, the stochastic oscillator indicates the pair is in a neutral zone with the lines pointing upward. However, the price remains below the key levels, suggesting that the market is not yet out of the bearish zone. Therefore, the trend will be confirmed if the price breaks above the $0.5288 level; otherwise, a consolidation seems likely and a downtrend if the price breaks below $0.5230.
You can purchase crypto coins here. Buy LBlock