Ripple (XRP/USD) Consolidates Near a Critical Level
Estimated Reading Time: 3 minutes
Don’t invest unless you’re prepared to lose all the money you invest. This is a high-risk investment and you are unlikely to be protected if something goes wrong. Take 2 minutes to learn more
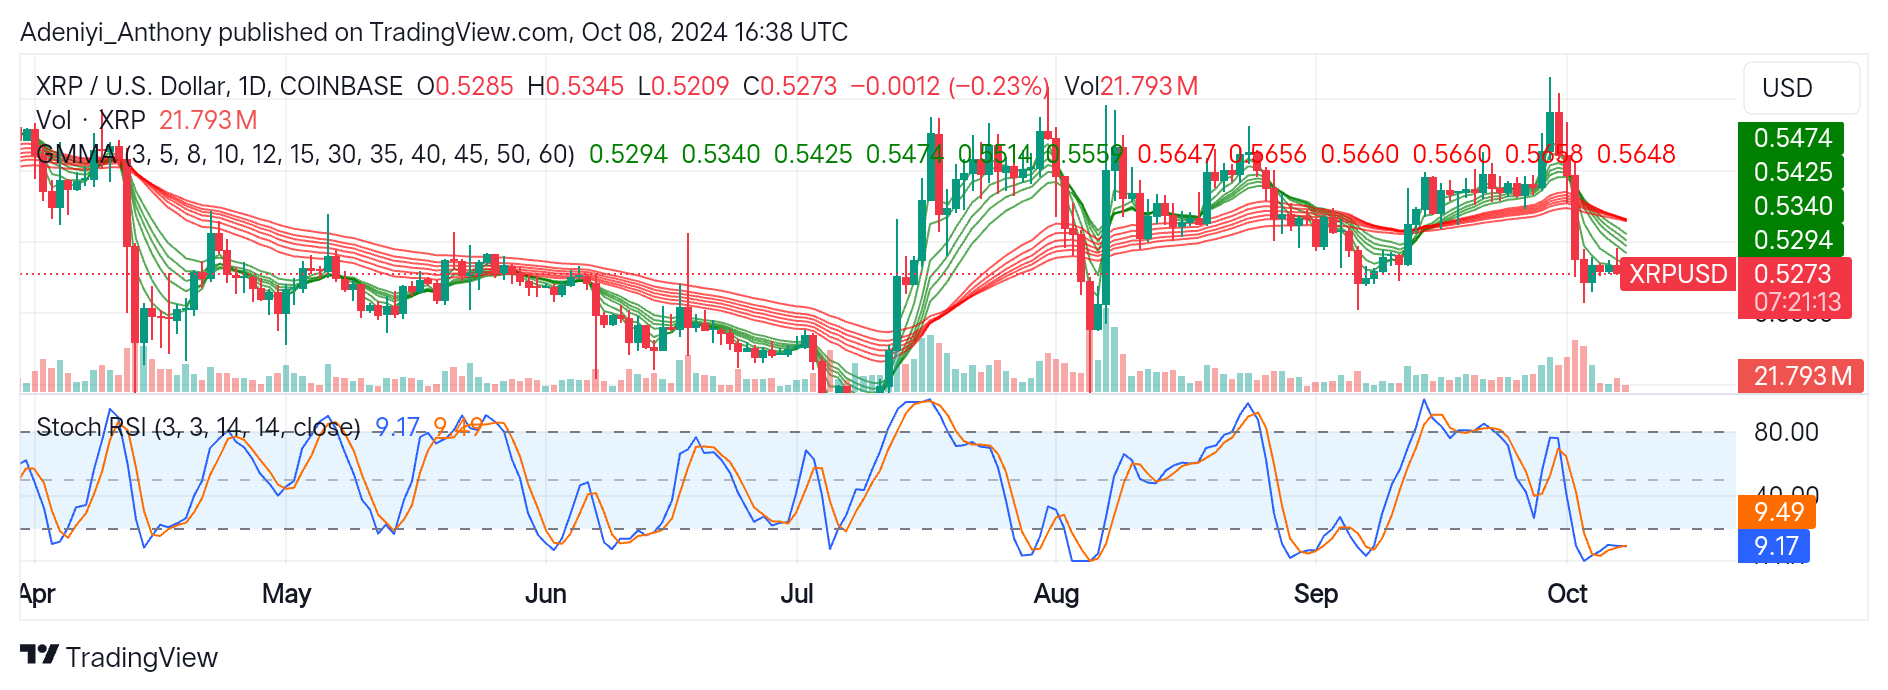
The Ripple according to the chart below, appears to be consolidating below the Guppy Multiple Moving Averages (GMMA). As signaled by the price movement, there has been some movement within a close range. The general market overview of this coin is slightly bearish. However, the trading volume is high, but the market is waiting for a clearer direction.
For some weeks, XRP/USD has been attempting to break the $0.56 but faced serious resistance due to increased and sustained seller pressure. Right now, the price is hovering in the $0.52 range.
However, for a breakout to occur, traders need more than indicators; the price needs to break the $0.55 level for a sustained uptrend; likewise, below the $0.52 would guarantee a downtrend toward the $0.5120 level. Currently, Ripple against the United States Dollar trades at $0.5273.
Technical Indicators
Major Resistance Levels: $0.5474, $0.5560, and $0.5666
Major Support Levels: $0.5294, $0.5209, and $0.5120
XRP/USD Technical Indicator Analysis
According to the GMMA, XRP/USD lies below the short-term period; this signifies caution from the short-term traders, but the long-term investors look unbothered. However, the crossover suggests the pair might experience a more downtrend if not reversed.
The stochastic Relative Strength Index displays the pair is currently operating in the oversold region. This indicates the XRP/USD is due for a short-term correction, but if there is no spike in trading volume, the consolidation phase might extend further.
Ripple’s Direction: A Breakout or Breakdown
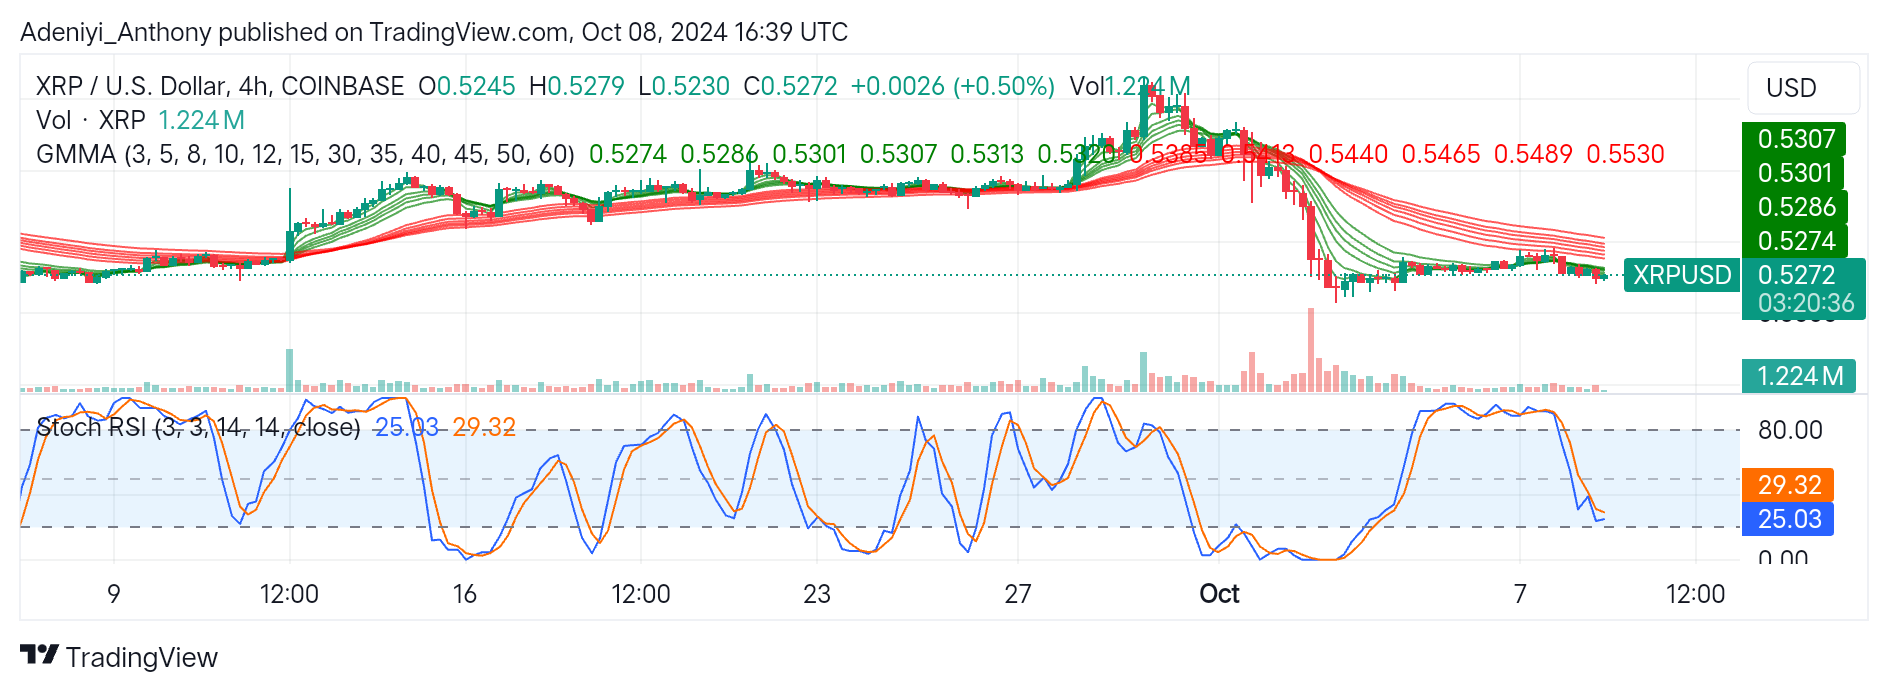
Ripple on the 4-hour chart is moving sideways but, bullishly with relatively low volume. This could bring about low-market activities in the short term. However, the price movement from high to low suggests XRP is currently experiencing a pullback.
XRP/USD is currently traded at the $0.5272 level. The GMMA suggests short-term traders are indecisive, while the long-term investors are unperturbed, as evidenced in the downward operating green lines and the evenly spread out red candles.
The Stochastic Relative Strength Index on the downside reflects the pair is close to the oversold region and reversal is about to play out. However, a break above the $0.5300 level might see the pair break further resistance.
In both timeframes, traders must watch out for key levels as the market ranges; $0.5300 and $0.5270 are crucial turning points for the pair.
You can purchase crypto coins here. Buy LBlock