Ripple (XRP/USD) Eyes $0.59262
Estimated Reading Time: 2 minutes
Don’t invest unless you’re prepared to lose all the money you invest. This is a high-risk investment and you are unlikely to be protected if something goes wrong. Take 2 minutes to learn more
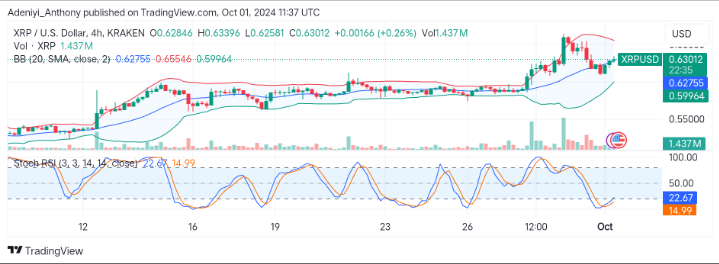
Ripple against the United States Dollar has been bullish recently. The pair’s price is currently hovering with the upper band of the Bollinger Bands. However, there are strong indicators that there might be a short-term pullback soon. The Stochastic Relative Strength Index (RSI) that operates in the overbought territory initially can be seen pointing downward.
Traditionally, the pair operation around the upper band signals an overbought condition. However, if the bulls supply more power, the $0.59262 might become a strong support level to break upside resistance. Presently, XRP is traded at $0.62952

Technical Indicators
Major Resistance Levels: $0.62956, $0.63400, and $0.65000
Major Support Levels: $0.59262, $0.55569, $0.55000
XRP/USD Technical Indicator Analysis
XRP/USD, as seen on the daily chart, is sloping upward with the upper band. However, Stochastic RSI suggests in the meantime bullish strength is waning and there might be a short-term pullback before further upward movement.
The abovementioned condition will be possible only if more bullish traders step in immediately when the price hits the $0.59262 level. Otherwise, a downtrend might surface.
What is the Next Move for XRP?
The formation of recent bullish candlesticks on the 4H chart signals that XRP/USD is bullish. The pair is currently traded at $0.63012, with the middle band acting as strong support.
On the downside, the Stochastic RSI indicates there is the possibility of a continuous uptrend as the indicator points upward from the oversold region.
All this will be possible if there is enough volume and bullish strength in the market; otherwise, a short-term pullback is also possible.
You can purchase crypto coins here. Buy LBlock