Synthetix (SNXUSD) Breaks the Bearish Flag Pattern to the Downside
Estimated Reading Time: 2 minutes
Don’t invest unless you’re prepared to lose all the money you invest. This is a high-risk investment and you are unlikely to be protected if something goes wrong. Take 2 minutes to learn more
SNXUSD Analysis – The Market Breaks the Bearish Flag Pattern to the Downside
Synthetix (SNXUSD) breaks the bearish flag pattern to the downside. The bearish flag pattern occurred due to the massive crash in the market. The channel formed by the bearish flag pattern was not strong enough to cause a complete reversal to the upside.
SNXUSD Significant Zones
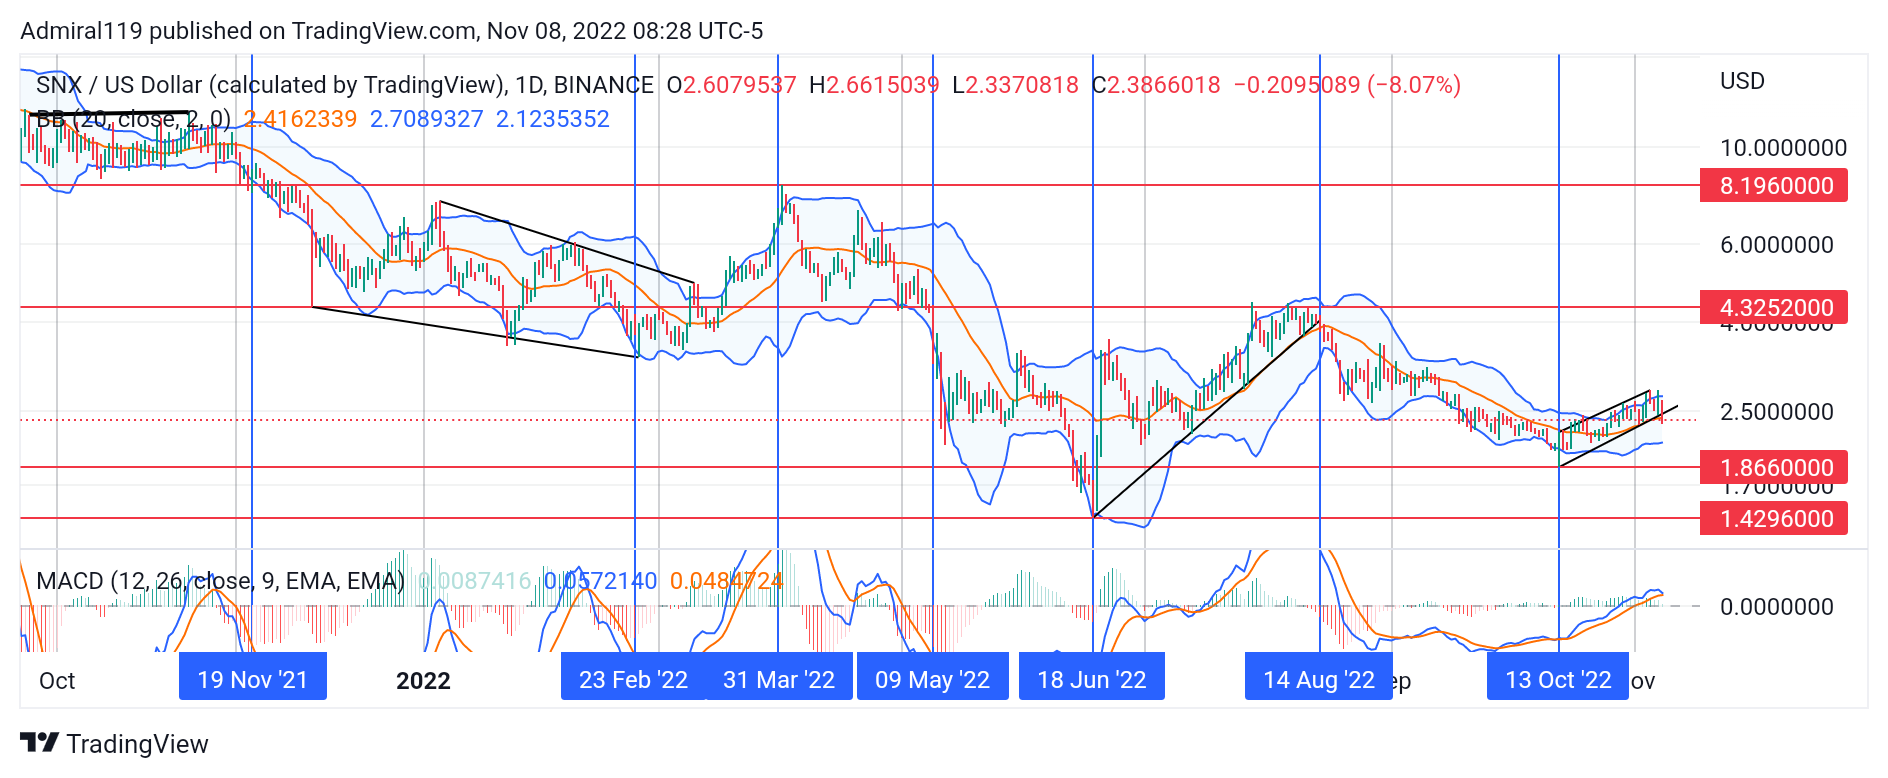
Demand Zones: $1.86600, $1.42960
Supply Zones: $4.32520, $8.19600
Just before the $8.19600 price level became a holy grail in the market, there was a period of consolidation as the price ranged within the Bollinger Bands. On the 19th of November last year, the resistance finally broke and the bears squeezed all the bulls out of the market. The bears kept on driving the market downward in an unclear pattern until they found a descending channel. This descending channel was later invalidated in February 2022 after the price concluded its gyrations about the $4.32520 price level. The retest on the $8.19600 resistance appears to be the last time SNXUSD will attain the price level this year, as all price actions now point downward.
On May 9, 2022, SNXUSD waned aggressively downward, clearing all hindrances until the $1.42960 demand zone was hit. The bulls stormed the market at this point and drove prices across an ascending trendline, which lasted for two months. Ever since then, the market has been steadily falling downward. On the 13th of October, 2022, the price’s direction was altered by the bulls’ buying pressure as the MACD indicator signaled bullish. The price remained in a rising channel, but the bullish trend ended prematurely. The short-lived channel indicates that prices were moving within a bearish flag pattern.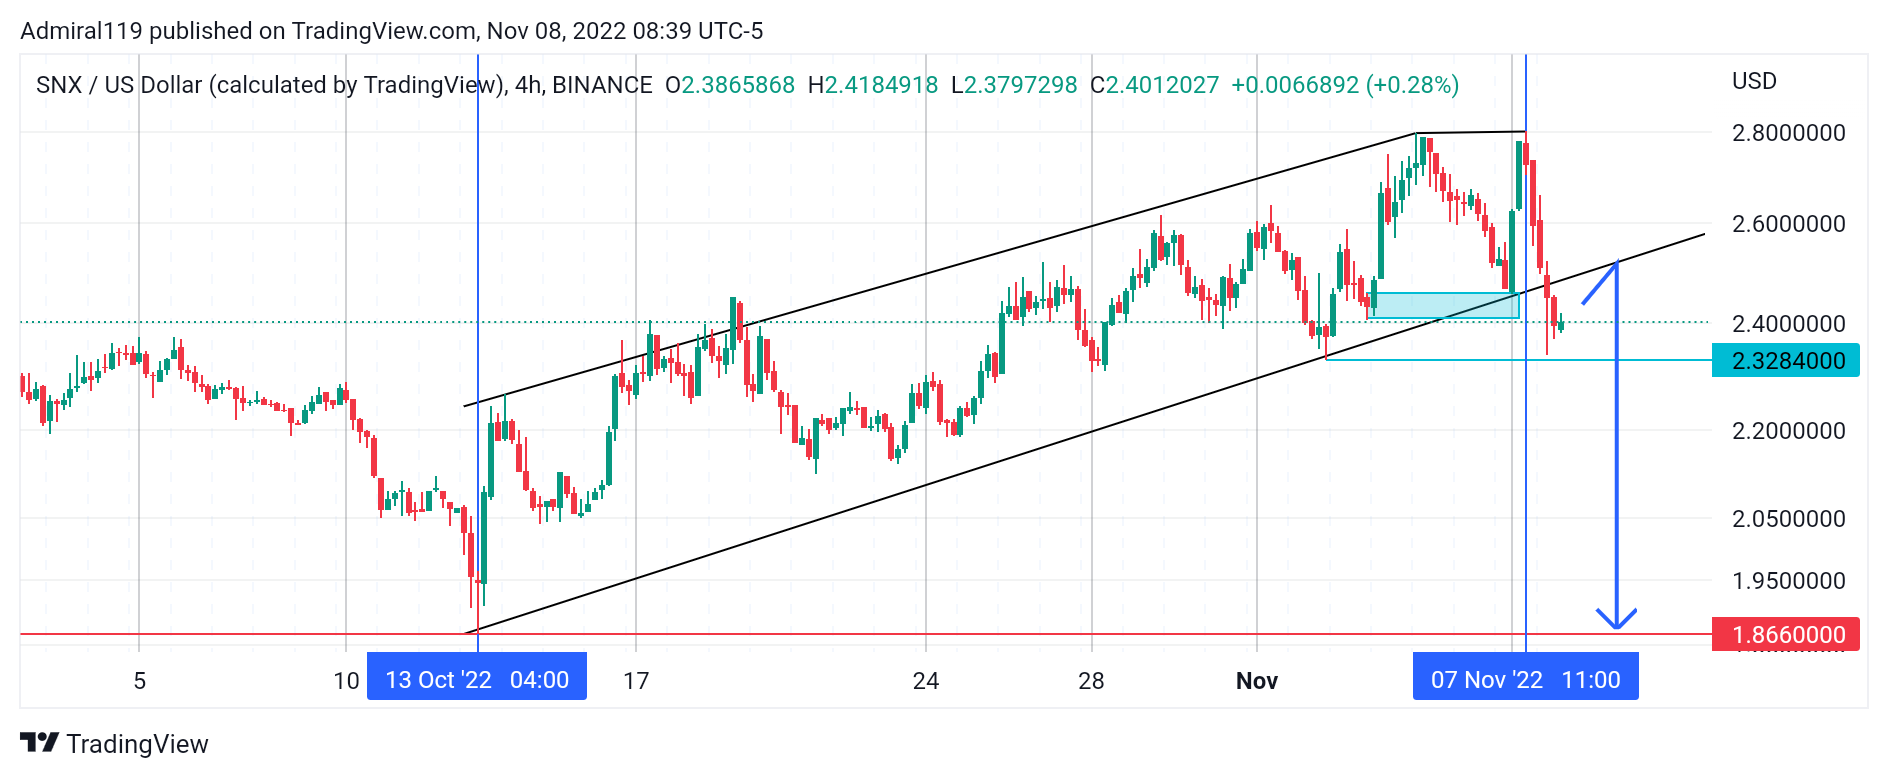
Market Expectation
Following the breakout of the bearish flag pattern on the four-hour chart, the diagonal support is expected to be retested as SNXUSD falls further.
Note: Cryptosignals.org is not a financial advisor. Do your research before investing your funds in any financial asset or presented product or event. We are not responsible for your investing results.