Polkadot Trades in the Bullish Trend as It Struggles Below $7.10
Estimated Reading Time: 2 minutes
Don’t invest unless you’re prepared to lose all the money you invest. This is a high-risk investment and you are unlikely to be protected if something goes wrong. Take 2 minutes to learn more
Polkadot (DOT) Long-Term Analysis: Bullish
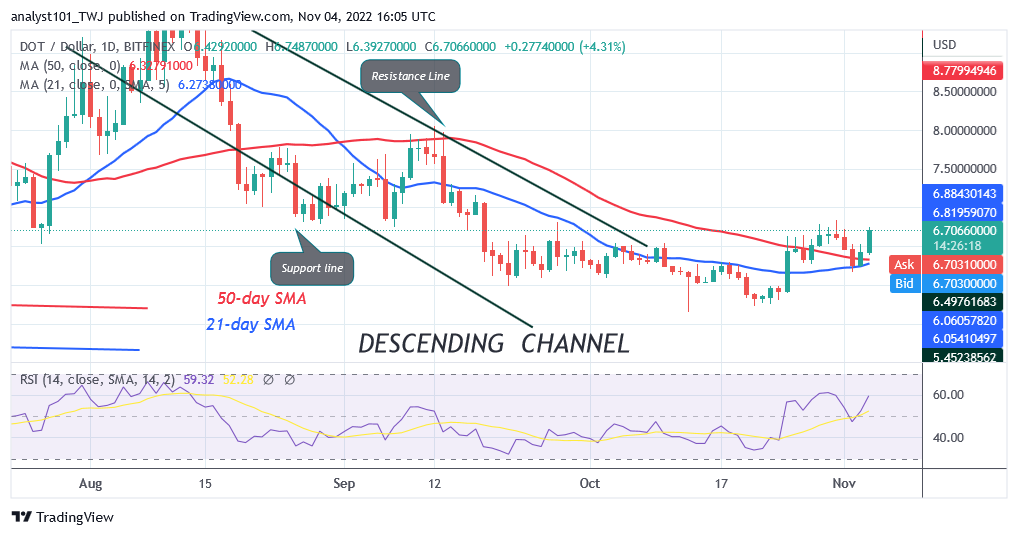
Polkadot (DOT) has rebounded as it struggles below $7.10. The current bullish momentum has reached an overbought region. At the $7.10 high, the bullish move above the moving average lines in the earlier price action was rejected. Today’s price movement might run with similar resistance. The initial resistance at $7.10 might be removed, though, by a price reversal. Up to the $8.00 high, the bullish trend will remain in effect. If the price falls beneath the moving average lines, selling pressure will resume. For instance, the DOT price would drop to its prior low at the $5.73 and $5.65 price levels. If the altcoin retraces and holds above the moving average line, the price surge will continue.
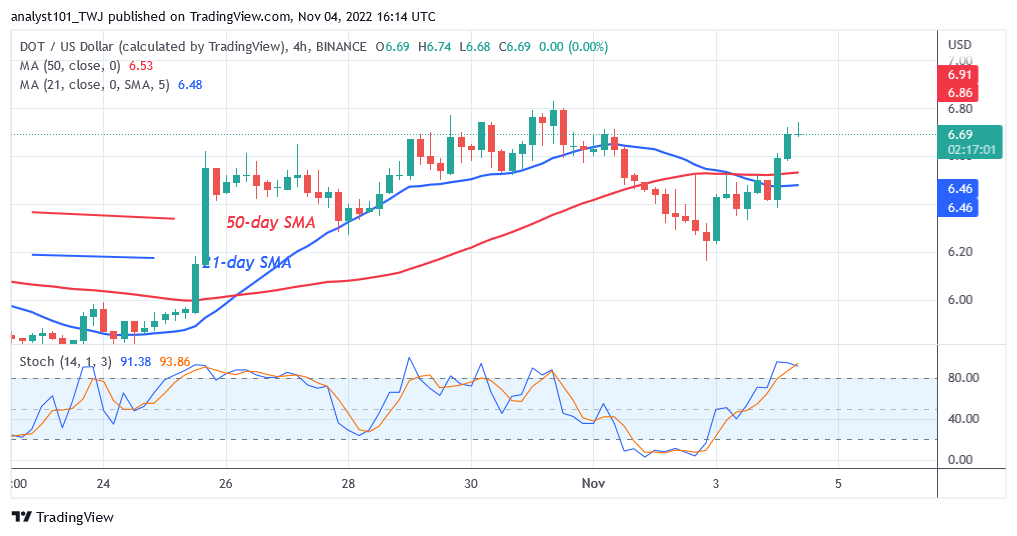
Polkadot (DOT) Indicator Analysis
For period 14, the DOT price is at level 64 on the Relative Strength Index. The alternative currency is on the upswing and still has room to rise. Since the price bars are above the moving average lines, the price of the cryptocurrency may increase once more. The slope of the moving average lines indicates a decline. The crypto’s price is currently above the 80% zone of the daily stochastic. The bullish trend that was currently in place has ended.
Technical indicators:
Major Resistance Levels – $10, $12, $14
Major Support Levels – $8, $6, $4
What Is the Next Direction for Polkadot (DOT)?
The coin is veering off to the side below the $6.85 barrier region as it struggles below $7.10. Since October 25, buyers have been desperately attempting to surpass the most recent high. Any upward movements of the cryptocurrency are being resisted since it is overbought.
You can purchase crypto coins here. Buy LBLOCK
Note: Cryptosignals.org is not a 1a financial advisor. Do your research before investing your funds in any financial asset or presented product or event. We are not responsible for your investing results