Bitcoin (BTC/USD) Price Is Indecisive at $22,500
Estimated Reading Time: 3 minutes
Don’t invest unless you’re prepared to lose all the money you invest. This is a high-risk investment and you are unlikely to be protected if something goes wrong. Take 2 minutes to learn more

Free Crypto Signals Channel
Bitcoin Price Prediction – July 31
The BTC/USD market is indecisive at $22,500. Price has been swinging up and down through the point over time. Presently, the price is trading at $23,833 at a minimal positive percentage rate of 0.60.
BTC/USD Market
Key Levels
Resistance levels: $25,000, $27,500, $30,000
Support levels: $20,000, $17,500, $15,500
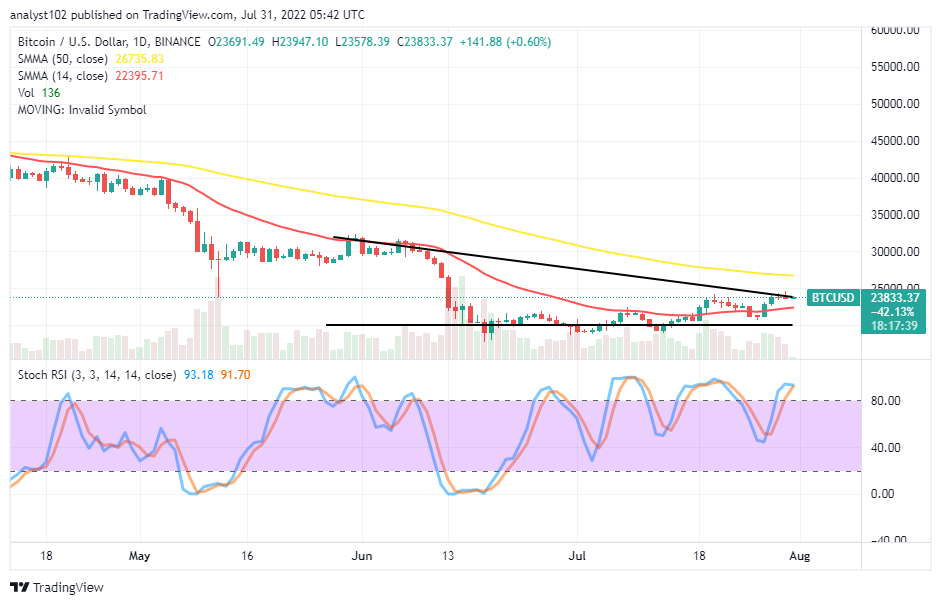
BTC/USD – Daily Chart
The BTC/USD daily chart showcases the crypto-economic price is indecisive at $22,500 level as there have a re-occurrence of smaller ups and downs around it going for a while. The 50-day SMA indicator is around $26,735.83 above the 14-day SMA indicator, and its positional value is $22,395.71. The Stochastic Oscillators are in the overbought region, seemingly attempting to close the lines within. It means there can be a pit stop at a higher-trading spot soon.
Is it technically inclined to follow a breakout of resistances around the BTC/USD market at $25,000 afterward?
The BTC/USD market operation is indecisive at $22,500 level. It is technically inclined that long-position placer to follow a breakout at the $25,000 to a higher spot while volatility is in motion to the upside. In other words, they should be wary of late entry to avoid any possible sign of bulls traps. The 14-day SMA trend line could be instrumental, serving as the baseline for where the presumed upward motion may span from at the end.
On the downside of the technical analysis, the bearish trend line drew southward to touch a resistance point where the price is, finding it hard to push past at around $23832.63. The BTC/USD market bears have to exert more pressure on the market from that value spot of $25,000. But, the highest is around the 50-day SMA trend line, which is at $26,735.83. Short-position placers needed to be cautious of a sudden breakout that propels the market through variant resistances.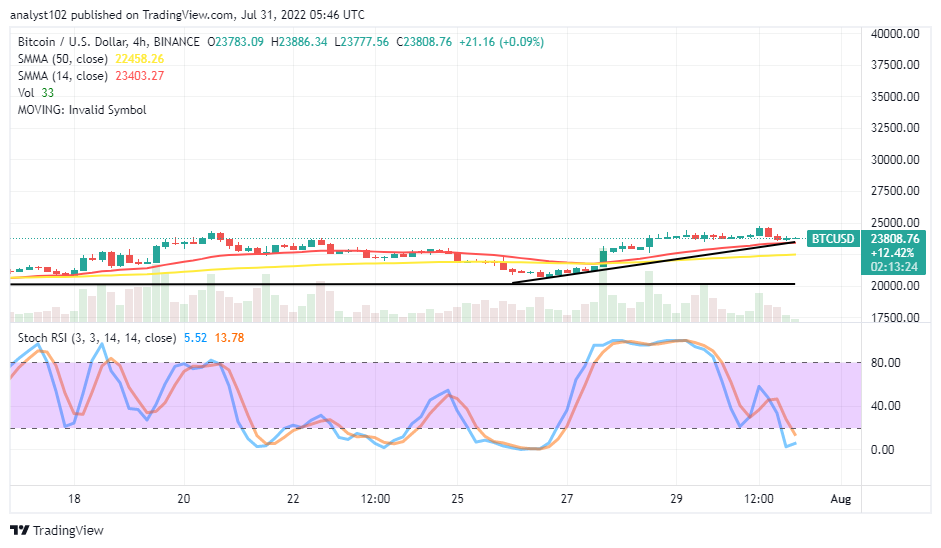
BTC/USD 4-hour Chart
The BTC/USD medium-term chart reveals the crypto-economic price is indecisive at $22,500 level as there have been smaller rises and smaller decreases at the value point. The 14-day SMA indicator is above the 50-day SMA indicator. The smaller SMA is at $23,403.27 over $22,458.26 of the bigger SMA on the trading chart. The Stochastic Oscillators are in the oversold region, trying to close the lines within to suggest the possibility of the market pausing for a while around its current trading spot.
Note: Cryptosignals.org is not a financial advisor. Do your research before investing your funds in any financial asset or presented product or event. We are not responsible for your investing results.
You can purchase Lucky Block here. Buy LBLOCK