The Graph (GRT/USD) Rises From the $0.1234 Price Level
Estimated Reading Time: 2 minutes
Don’t invest unless you’re prepared to lose all the money you invest. This is a high-risk investment and you are unlikely to be protected if something goes wrong. Take 2 minutes to learn more
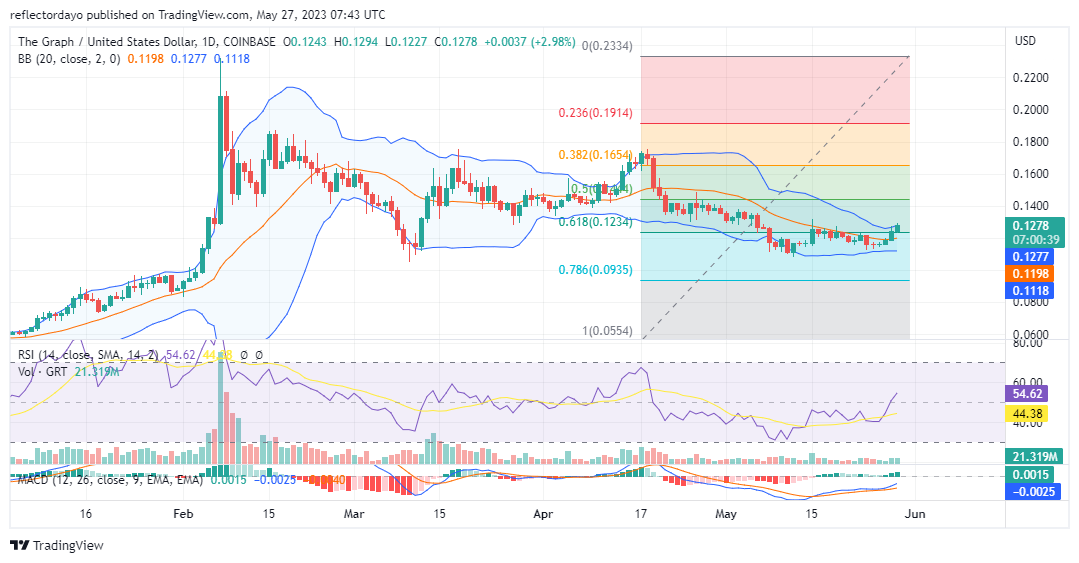
After The Graph market fell from the $0.233 price level on February 7, a lower resistance level formed around $0.175. This new support level lasted till May 18, when bears overran the market, and it found support below $0.1234. The $0.1234 price level has now become a major resistance level that must be overcome for the bullish trend to be established.
GRT Market Data
- GRT/USD Price Now: $0.127
- GRT/USD Market Cap: $1,142,175,552
- GRT/USD Circulating Supply: 8,993,519,372 GRT
- GRT/USD Total Supply: 10,665,253,069
- GRT/USD Coinmarketcap Ranking: #41
Key Levels
- Resistance: $0.135, $0.140, and $0.145.
- Support: $0.110, $0.100, and $0.090
Price Prediction for The Graph: The Indicators’ Point of View
$0.1234 is the 61.8% Fibonacci level. That explains the reason for the struggle around the price level. On May 25 and May 26, the markets for these days were represented by the plus sign dojis, which is a sign of strong indecision. It was also an indication that the bearish trend may soon give way to a bullish trend. Therefore, starting on May 27, The Graph market began to trend up. Today’s market is also bullish, and it issues from $0.1234, but due to the struggle with bearish resistance and the low volume of trade, the upper band of the Bollinger Bands did not respond well to bullish activities.
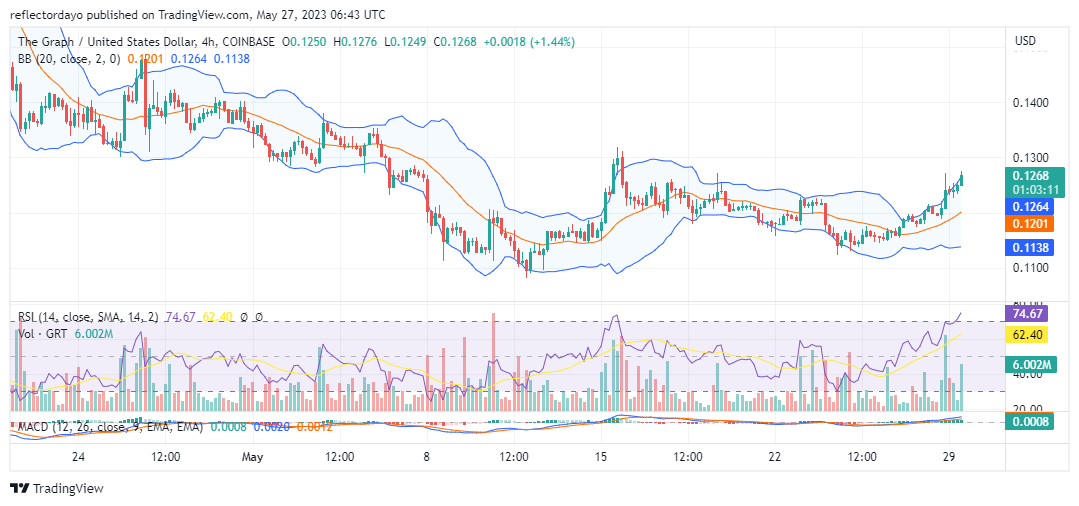
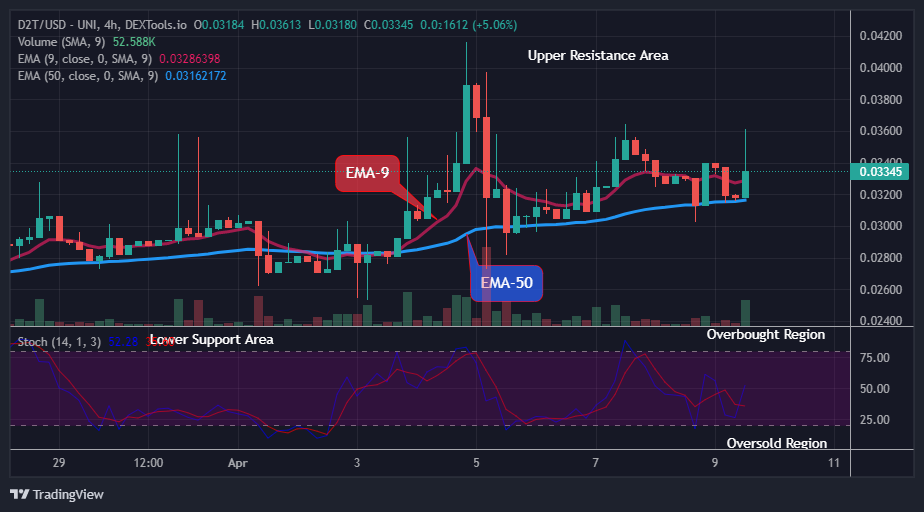
GRT/USD 4-Hour Chart Outlook:
On a 4-hour timeframe, the volume of trade is considered sufficient to keep the bull market on course. From this point of view, the volatility is increasing, but the buyers are having the upper hand. Bullish sentiment is growing at the $0.1234 price level. With the moderate level of volatility in this market, we may still see more upside market trends.