Ripple Is in a Decline as It Revisits the $0.40 High
Estimated Reading Time: 3 minutes
Don’t invest unless you’re prepared to lose all the money you invest. This is a high-risk investment and you are unlikely to be protected if something goes wrong. Take 2 minutes to learn more
Ripple (XRP) Long-Term Analysis: Bearish
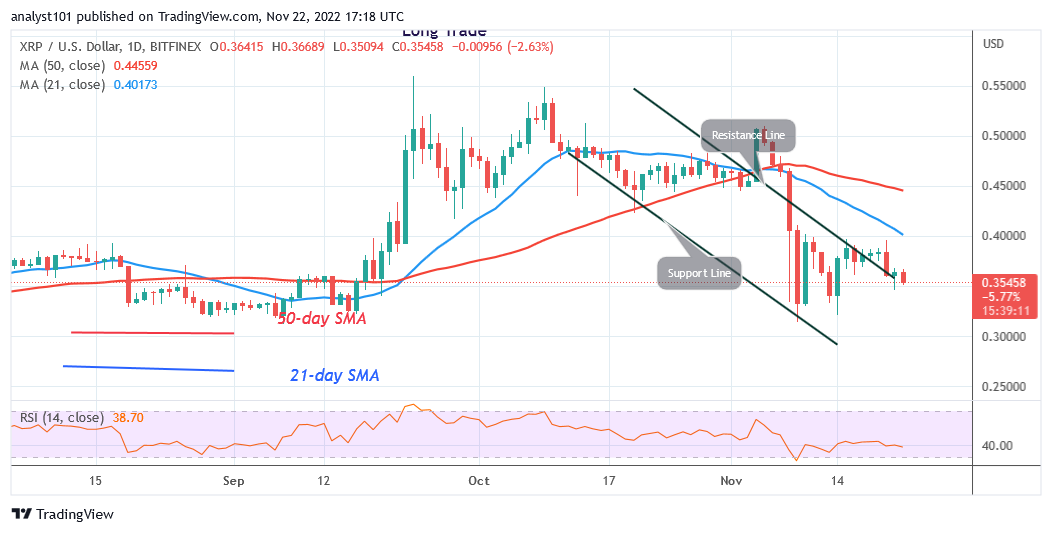
Ripple (XRP) has been ranging between $0.31 and $0.40 as it revisits the $0.40 high. The altcoin is currently surging to retest or break the $0.40 resistance. The cryptocurrency will begin to trend once the range-bound levels are crossed. Sellers are attempting to break through the existing support as a result of an unsuccessful upward corrective, according to all the signs. XRP has fluctuated above the existing support as a result of the price war between buyers and sellers. If the bears succeed in breaking through the $0.31 support, the downside is that XRP will further decline to a low of $0.20. On the other hand, the altcoin will restart its upward trajectory if price spikes and breaks through the resistance level at $0.40. The upward trend will last till a $0.50 high.
Ripple (XRP) Indicator Analysis
On the Relative Strength Index, Ripple is at level 38 for period 14. XRP is in a downtrend zone and may continue to decline. Price bars have persisted in trading below the moving average line, suggesting that XRP will continue to decline. The cryptocurrency is moving in a bullish direction at level 30 of the daily Stochastic. Momentum for the bulls has been fragile recently.
Technical indicators:
Major Resistance Levels – $2.00, $2.50, $3.00
Major Support Levels – $1.50, $1.00, $0.50
What Is the Next Direction for Ripple (XRP)?
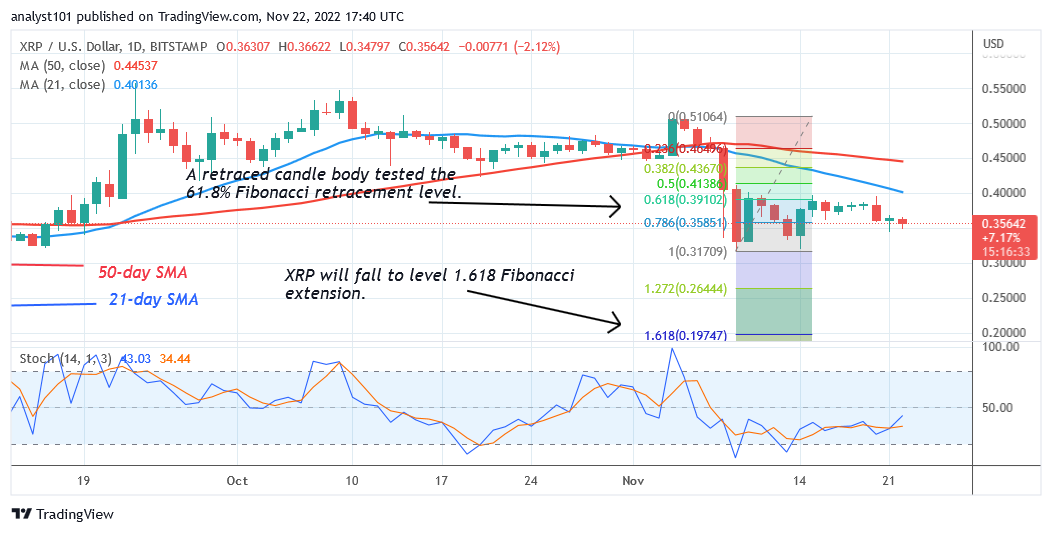
As it starts moving up once more, Ripple is in positive momentum as it revisits the $0.40 high. The present upswing is most likely to reach an overbought area, where a decline will occur. According to the Fibonacci tool, XRP is expected to keep dropping below the $0.31 support. On November 9, amid the downturn, XRP made an upward adjustment, and a candle body tested the 61.8% Fibonacci retracement line. According to the correction, XRP will drop to the Fibonacci extension’s level of 1.618, or $0.19.
You can purchase crypto coins here. Buy LBLOCK
Note: Cryptosignals.org is not a financial advisor. Do your research before investing your funds in any financial asset or presented product or event. We are not responsible for your investing results