Ripple Reaches Oversold Region but Holds above $0.31 Low
Estimated Reading Time: 3 minutes
Don’t invest unless you’re prepared to lose all the money you invest. This is a high-risk investment and you are unlikely to be protected if something goes wrong. Take 2 minutes to learn more
Ripple (XRP) Long-Term Analysis: Bearish
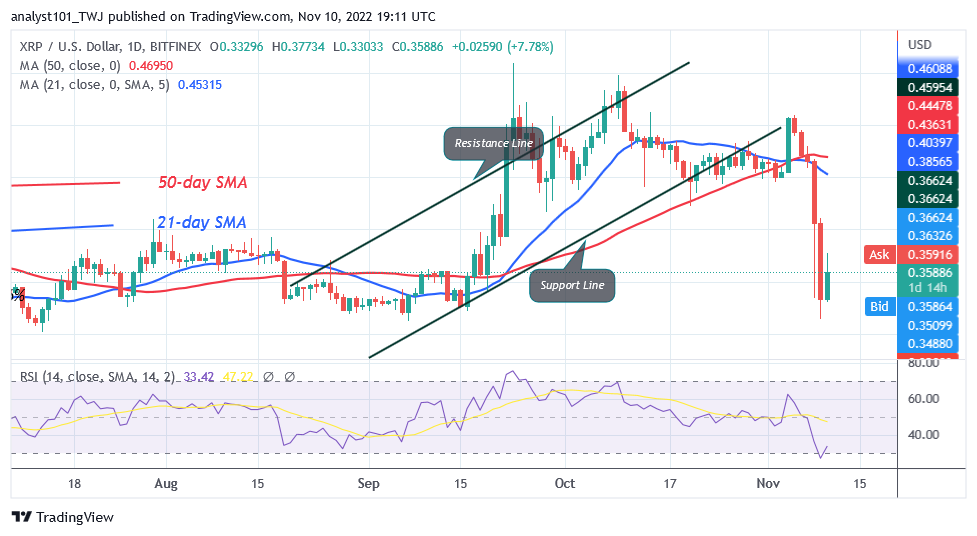
Ripple (XRP) is in a downtrend but holds above $0.31 low, The altcoin reached a low of $0.31 after sellers broke through the $0.41 support. XRP has crossed into oversold territory as a result of the current downturn. The consequence is that as buyers start to appear in the oversold region, XRP’s upward trend will shortly restart. The present support is the historical price level of August 28. The current support was held for two weeks before the September price recovery. Bulls purchased the dips today, which caused XRP to drop to a low of $0.3148. The altcoin has corrected upward, but the high of $0.37 is still acting as a roadblock. The market may rise to its prior highs if buyers push the price over the 21-day line SMA or $0.41 high.
Ripple (XRP) Indicator Analysis
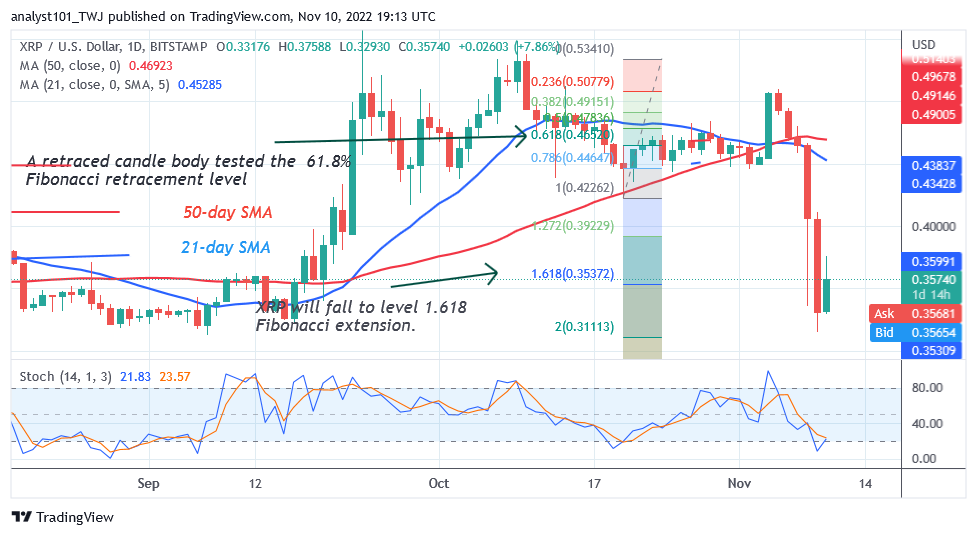
For period 14, Ripple is at level 34 on the Relative Strength Index. It implies that XRP is declining and might do so in the future. The daily stochastic is below XRP at a level of 20. The oversold region has been achieved by the current XRP downward movement. In the oversold area, buyers are expected to show up and take over control of the prices.
Technical indicators:
Major Resistance Levels – $2.00, $2.50, $3.00
Major Support Levels – $1.50, $1.00, $0.50
What Is the Next Direction for Ripple (XRP)?
The pinnacle of the declining trend has been reached but holds above the $0.31 low. The 61.8% Fibonacci retracement level was tested by the candle body of XRP on October 20, when the cryptocurrency reversed its negative trend. XRP is expected to drop below $0.35, or level 1.618 of the Fibonacci extension, according to the correction. The price trend indicates that XRP dropped to a low of $0.3148 before beginning to increase once more.
You can purchase crypto coins here. Buy LBLOCK
Note: Cryptosignals.org is not a financial advisor. Do your research before investing your funds in any financial asset or presented product or event. We are not responsible for your investing results