POL (ex-MATIC) Price Prediction: POL/USDT Retreats Below $0.5000
Estimated Reading Time: 3 minutes
Don’t invest unless you’re prepared to lose all the money you invest. This is a high-risk investment and you are unlikely to be protected if something goes wrong. Take 2 minutes to learn more

POL (ex-MATIC) Price Prediction (January 18):
POL (ex-MATIC) has recovered from falling below the lower boundary of the symmetrical triangle on the chart. However, its attempt to break through the $0.5000 resistance level was met with selling pressure, causing the market to retreat below the mentioned price level.
POL/USDT Long-Term Trend: Bearish (Daily Chart)
Key Price Levels:
Resistance: $0.5000, $0.6000, $0.7000
Support: $0.4500, $0.4000, $0.3500
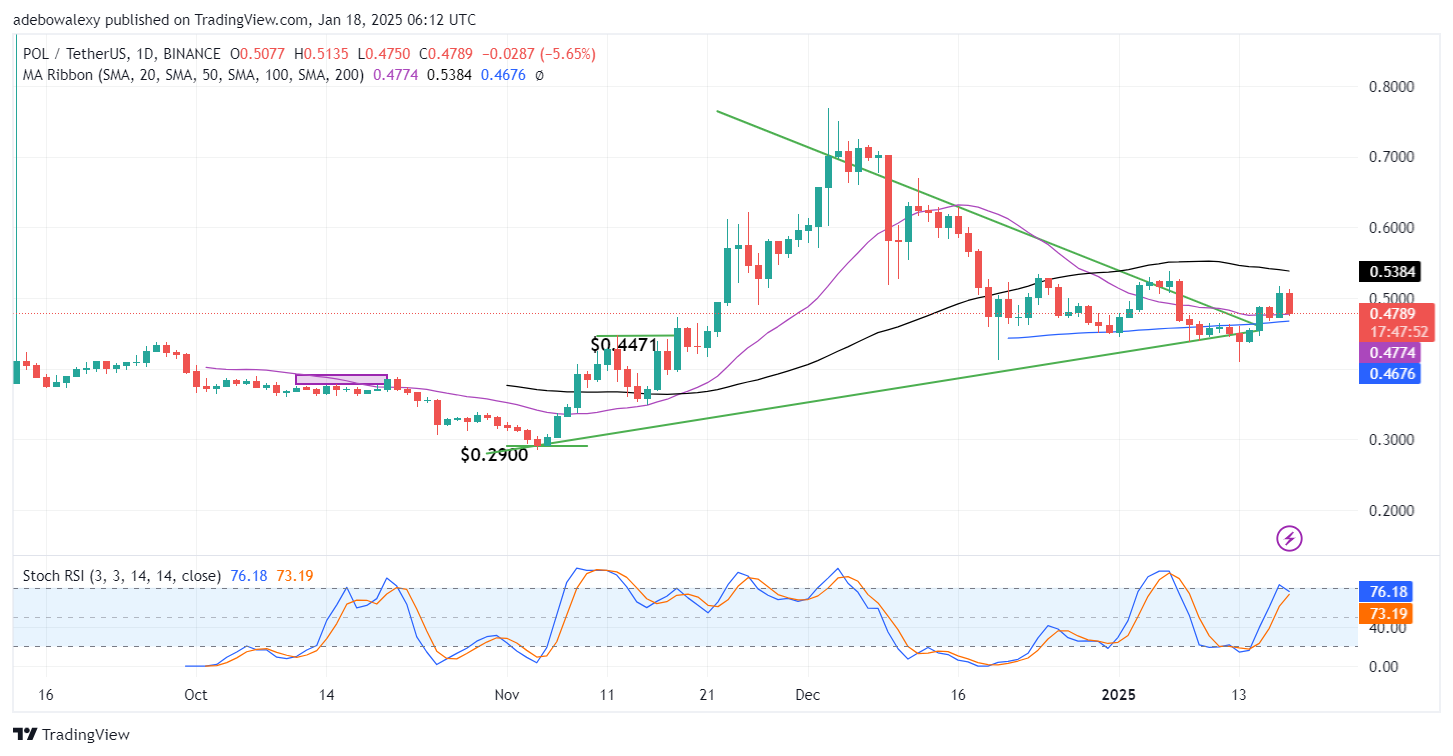
The previous session in the POL (ex-MATIC) daily market showed significant bullish momentum with the appearance of a green candle. However, the most recent price candle as of this writing is red, pulling the market back below the $0.5000 mark. Despite this, the price remains above the 20-day and 200-day Moving Average (MA) lines. Additionally, the Stochastic Relative Strength Index (RSI) lines are converging for a crossover above the 70 level, indicating that bullish sentiment could still regain strength.
POL (ex-MATIC) Price Prediction: POL/USDT Could Rise Back Above $0.5000
Price action in the POL (ex-MATIC) daily market has experienced a setback, as reflected in the latest red candle. However, the price remains above most of the MA lines on the chart.
The potential bearish crossover has not yet materialized and could be avoided if buyers regain control near the support formed by the 20-day MA line. This suggests that bullish momentum may still have the potential to recover, but it could require the influence of a strong catalyst to re-establish dominance.
POL (ex-MATIC) Price Prediction: POL/USDT Maintains a Higher Support (4-Hour Chart)
On the 4-hour chart, price action has retraced sharply toward a lower support level, falling below most of the MA lines. However, the price is still holding above a higher support level.
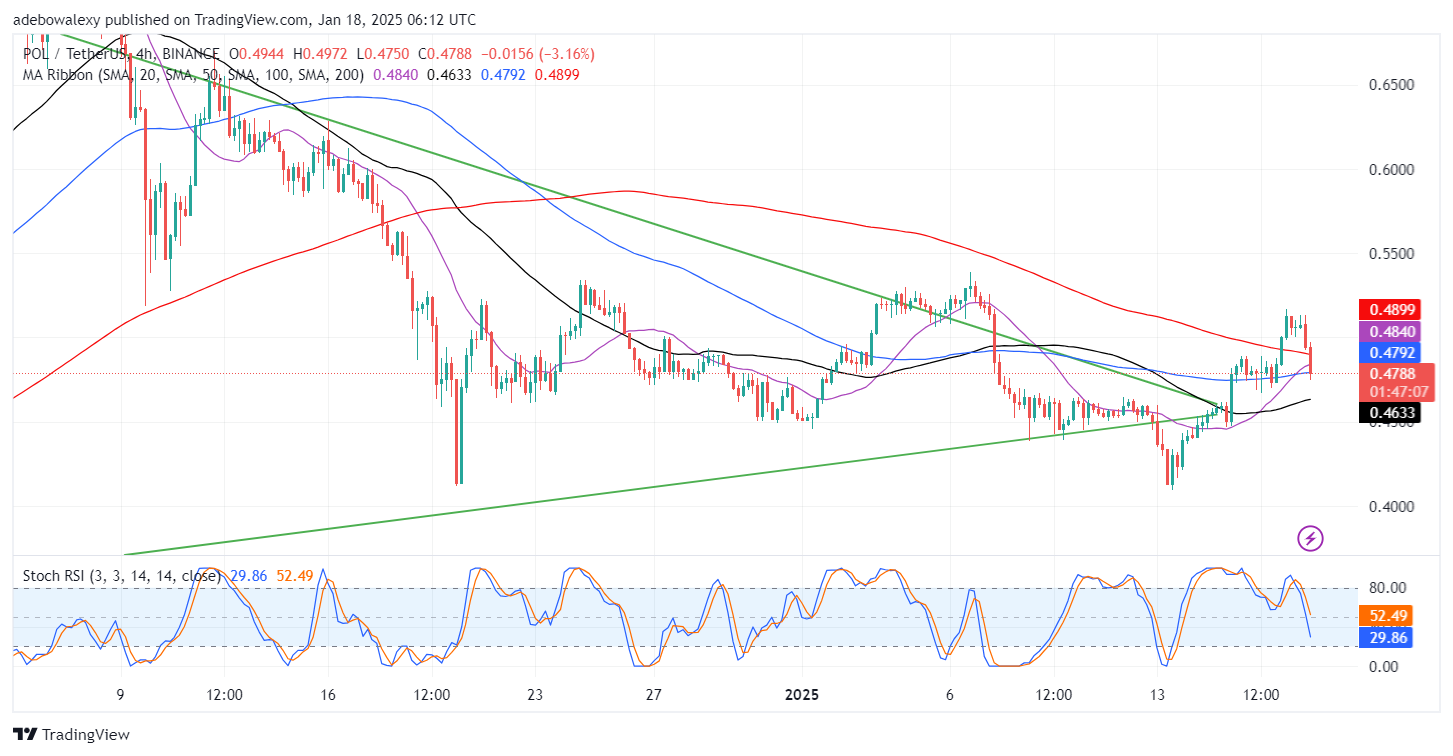
The Stochastic RSI lines are declining sharply into the oversold region, indicating the dominance of bearish momentum. This is further confirmed by price action falling below most of the MA lines. Consequently, the price could approach the $0.4633 mark, where a potential rebound may occur. Any such rebound may require support from a significant market catalyst.