Polkadot (DOT/USDT) Compression Phase Signals Impending Breakout
Estimated Reading Time: 3 minutes
Don’t invest unless you’re prepared to lose all the money you invest. This is a high-risk investment and you are unlikely to be protected if something goes wrong. Take 2 minutes to learn more
Polkadot Long-term Analysis: Ranging
Polkadot against the Tether has been showing signs of consolidation as it trades sideways in a tight range between $2.990 and $3.446. However, the bigger picture appears neutral to slightly bearish, with prolonged declining volume and price movement, especially after the failed breakout above $7.500 earlier in 2024.
Recently, the price has settled above the lower Bollinger Band, indicating low volatility and a potential setup for a strong directional move. However, since the price has held support around $3.000 multiple times, bulls may attempt a rebound soon.
To this end, Polkadot trades at $3.426, printing over 6 million traded volumes for the week.
Technical Indicators
Major Resistance Levels: $4.057, $5.130, and $7.500
Major Support Levels: $2.986, $2.500, and $2.000
Polkadot Technical Analysis
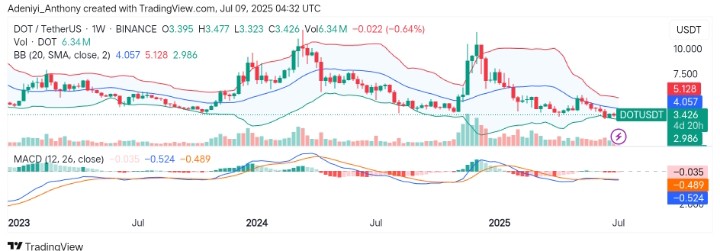
The weekly analysis of Polkadot against the Tether shows the pair has been oscillating within a tight channel as the tightening bands suggest a potential volatility expansion. However, the bearish MACD appears flattened out with reducing histogram bars, suggesting weakening downside momentum.
From another end, the volume declines steadily, following the compression and squeeze pattern. To this end, a bullish close above $3.700 with increasing volumes would suggest a reversal; otherwise, a move toward $2.986 is imminent.
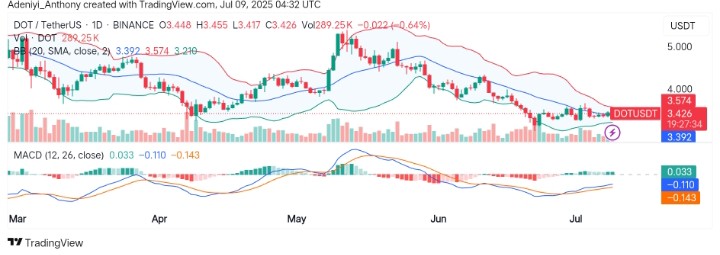
DOT/USDT Analysis: Building a Base Above Dynamic Level
On the daily timeframe, DOT/USDT is trading tightly between $3.390 and $3.570. This indicates a potential breakout lies ahead, as the price trades between a narrowing Bollinger Bands. This signals a reduced volatility, which often precedes a strong price move.
However, the MACD has flipped slightly bullish, crossing above the signal line and moving into positive territory. With the price now resting near the mid-band, a clean break above $3.574 could confirm a bullish breakout attempt.
To this end, as long as the price holds above the $3.392 support, buyers may remain confident in short-term upside potential.
You can purchase crypto coins here. Buy LBlock