Lucky Block Price Prediction: LBLOCK/USD Touches $0.000026 Low; Time to Buy the Dips!
Estimated Reading Time: 3 minutes
Don’t invest unless you’re prepared to lose all the money you invest. This is a high-risk investment and you are unlikely to be protected if something goes wrong. Take 2 minutes to learn more
Lucky Block Price Prediction – November 17
The Lucky Block price prediction shows that LBLOCK is hovering around $0.000027 as the buying pressure gathers for the upside.
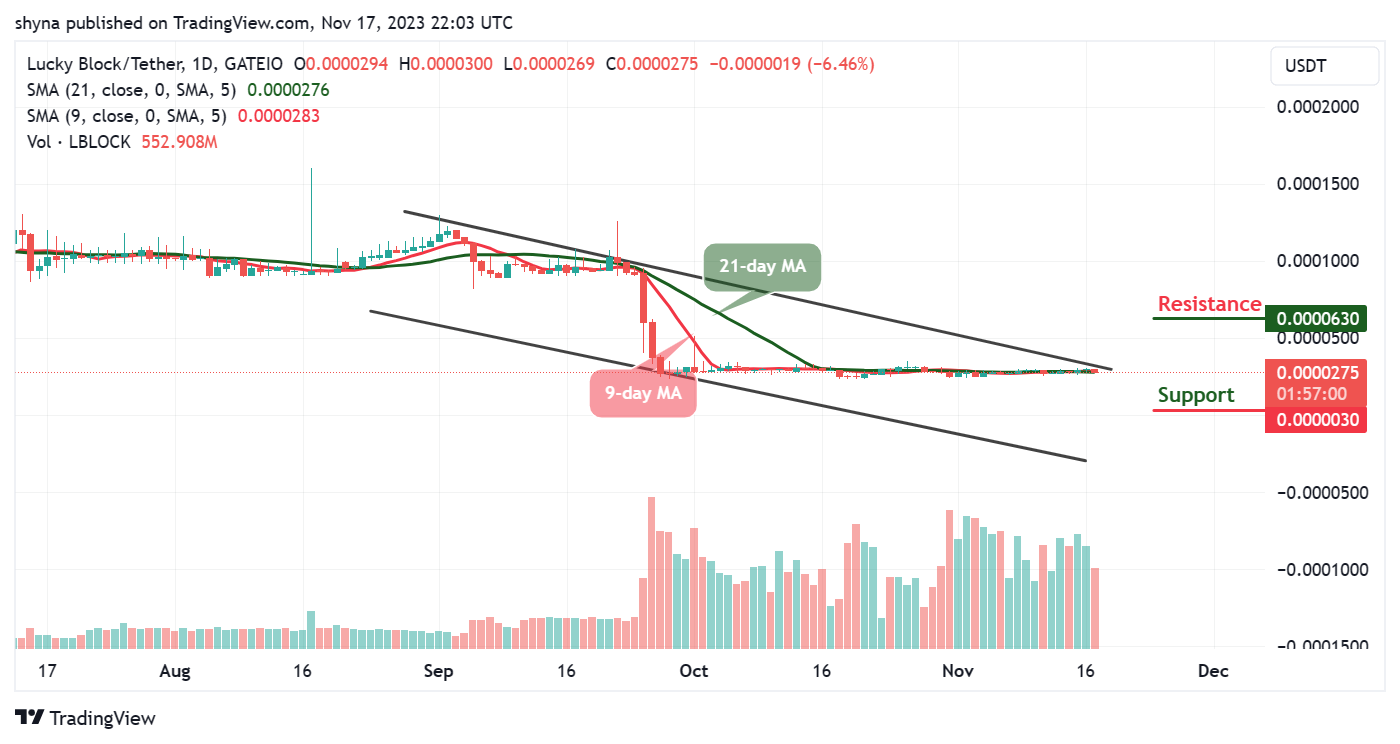
LBLOCK/USD Long-term Trend: Ranging (1D Chart)
Key Levels:
Resistance levels: $0.000063, $0.000065, $0.000067
Support levels: $0.000003, $0.000002, $0.000001
LBLOCK/USD price is currently hovering at $0.000027, gearing up for an anticipated bullish surge. However, analysis of the present trend indicates a potential upward movement once the coin reclaims positions above the 9-day and 21-day moving averages. This development is expected to attract increased investments from both new and existing buyers, pointing toward a positive trajectory for LBLOCK shortly.
Lucky Block Price Prediction: LBLOCK/USD Prepares for the Upside
The Lucky Block price is poised for a bullish trajectory once it reaches the crucial support level of $0.000025. Meanwhile, in the event of a delay in this upward movement, potential challenges may arise, creating more opportunities for new investors to enter, albeit with increased bearish pressure. Notably, additional support levels are anticipated at $0.000003, $0.000002, and $0.000001.
Nevertheless, a glance at the daily chart reveals a promising outlook, with the Lucky Block price gearing up for a bullish trend as the 9-day Moving Average (MA) positions itself for a crossover above the 21-day MA. This development signals positive momentum. Meanwhile, prospective resistance levels at $0.000063, $0.000065, and $0.000067 are crucial points where buyer activity is expected to intensify, potentially shaping the market dynamics.
LBLOCK/USD Medium-term Trend: Ranging (4H Chart)
The 4-hour chart revealed that the Lucky Block price is moving below the 9-day and 21-day moving averages. Meanwhile, should the price head toward the upper boundary of the channel; the coin will experience an upward trend and could touch the resistance level at $0.000030 and above.
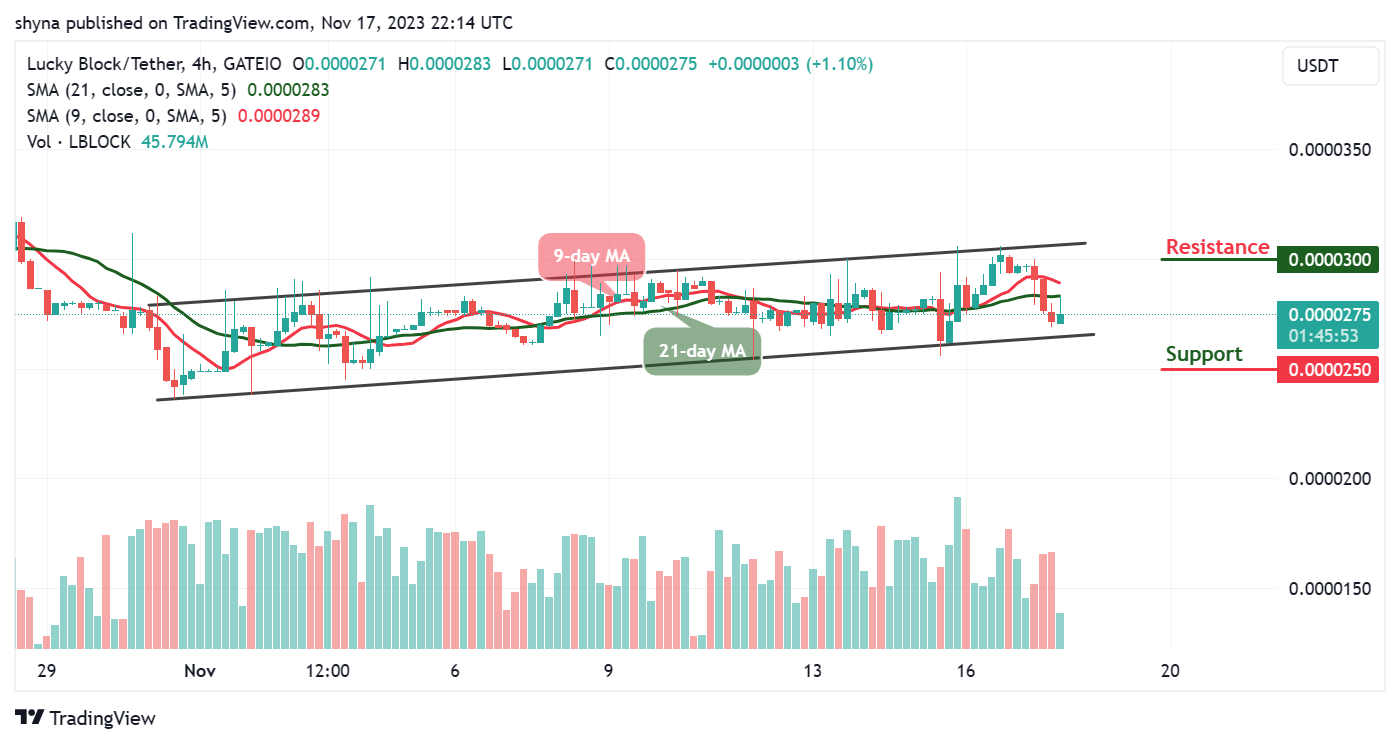
Moreover, if the bulls increase the buying pressure within the channel, LBLOCK/USD would cross above the upper boundary of the channel. On the contrary, the Lucky Block price can retreat and cross below the lower boundary of the channel to hit the support at $0.000025 and below. However, the 9-day MA is still above the 21-day MA, getting ready for a movement to the positive side.
You can purchase Lucky Block here. Buy LBLOCK