Bitcoin (BTC/USD) Trades Lower Underneath the Key Resistance of $60,000
Estimated Reading Time: 3 minutes
Don’t invest unless you’re prepared to lose all the money you invest. This is a high-risk investment and you are unlikely to be protected if something goes wrong. Take 2 minutes to learn more
Bitcoin Price Prediction – May 12
Majorly, the resistance line of $60,000 has been very difficult for the BTC/USD to push past as it occurred sometimes back On March 14 and some subsequent days’ sessions. Presently, the market is trading around $57,390 level with about a 1.17% increase.
BTC/USD Market
Key Levels:
Resistance levels: $60,000, $65,000, $70,000
Support levels: $50,000, $45,000, $40,000
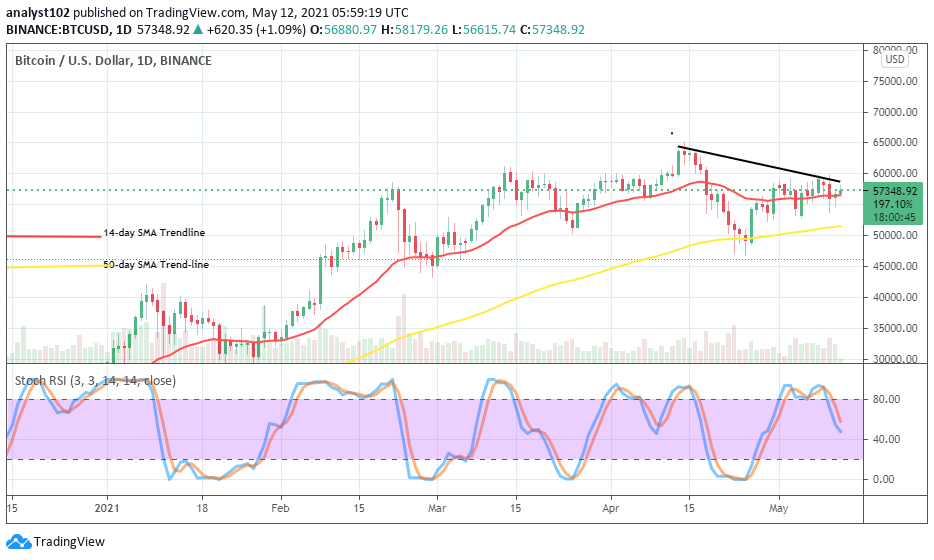
BTC/USD – Daily Chart
The BTC/USD daily chart still shows that the crypto-market is being held for long below the main immediate resistance value of $60,000. On May 10, a bearish candlestick formed briefly past the level of $55,000. But, shortly got an upward reverse back a bit over the trading line to now feature very small two candlesticks with a bullish outlook performance. The 14-day SMA is located over the 50-day SMA indicator. The Stochastic Oscillators have moved down from the overbought region to seemingly attempt crossing back to the north in the near time.
Will the BTC/USD market continue pricing low below the $60,000 line?
The bearish trend-line drew over the market space to affirm how crucial the immediate resistance line is. As a result, it may still take the BTC/USD bulls sometimes to surge breaking past the $60,000 resistance level as there has been no much-required capacity-building set up to run northwardly in the market presently. In that case, price only tends to continually hover around the level of $55,000 more.
In regards to the downside, the market level of $60,000 will also play a crucial role in determining a sell order in this market. A touch or a reversal after a fake breakout of the point will suffice the decent bears’ entry. However, if that assumed scenario doesn’t play out accordingly, a violent push against the level will propel price running towards the last previous value of $65,000. A sell order at the level earlier mentioned will be whipsawed probably for a long time.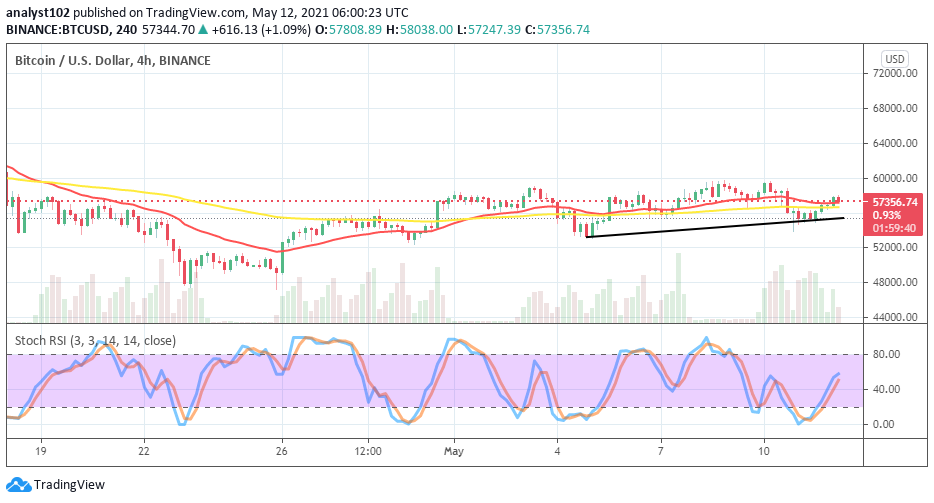
BTC/USD 4-hour Chart
It is closely being observed from the viewing point that the medium-term depicts what has been happening in the market operations between BTC and the US Dollar has an outlook of range-bound movements. The market level of $56,000 has slightly breached southward on two different trading occasions. And, the $60,000 level remains strongly resistant to further up-movements. The 14-day SMA is closely located over the 50-day SMA in those price points earlier mentioned pointing toward the east to suggest an ongoing range motion. The Stochastic Oscillators have moved upward from the oversold region to attempt closing the hairs a bit above range 40. That could eventually lead to signaling a slight downward move in the market. But, it may not live long afterward.
Note: cryptosignals.org is not a financial advisor. Do your research before investing your funds in any financial asset or presented product or event. We are not responsible for your investing results.