Universal Market Access (UMA/USD) Bulls Rally as $4.00 Support Holds Firm, Eyeing $6.00 Target
Estimated Reading Time: 3 minutes
Don’t invest unless you’re prepared to lose all the money you invest. This is a high-risk investment and you are unlikely to be protected if something goes wrong. Take 2 minutes to learn more
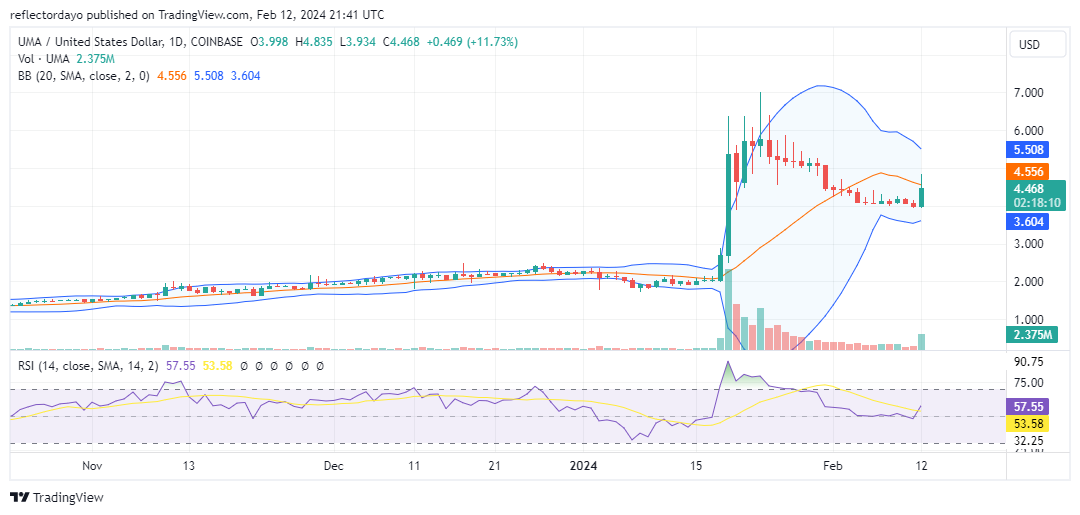
Following the bullish surge that propelled Universal Market Access (UMA) to its peak at $7.00, the price subsequently began a decline. Nonetheless, amidst this bearish movement, discernible traces of bullish sentiment emerged, manifesting in the formation of spinning tops and long-legged dojis on the candlestick charts as the price gradually descended. In February, bullish momentum solidified, with support firmly established at the $4.00 price threshold. This stabilization effectively curtailed further downward movement, resulting in a sideways consolidation of prices around this level. However, during today’s trading session, the market experienced a breakout from this narrow price range.
The UMA Market Data
- UMA/USD Price Now: $4.50
- UMA/USD Market Cap: $348 million
- UMA/USD Circulating Supply: 78 million
- UMA/USD Total Supply: 118 million
- UMA/USD CoinMarketCap Ranking: #144
Key Levels
- Resistance: $5.00, $5.50, and $6.00.
- Support: $4.00, $3.50, and $3.00.
The Universal Market Access Analysis: The Indicators’ Point of View
From the crypto signal coming from the daily chart, a notable price breakout in favor of bullish sentiment is evident, as indicated by both the price action and the volume of trade histogram. This reflects heightened investor activity during today’s trading session, leading to a significant surge in investor interest and subsequently causing the price to break out from the narrow price range near $4.00. Observation of the candlestick pattern reveals a transition to bearish activity following the price reaching a high of $4.84.
Nevertheless, it is pertinent to note that the confirmation of this market shift still requires further validation. Specifically, the price action must surpass the 20-day moving average, and the direction of the Bollinger Bands indicator should shift from a downward trajectory. Additionally, a key challenge for the bulls in Universal Market Access lies in overcoming the resistance level at $5.00, as evident from the upper shadow observed on today’s candlestick chart.
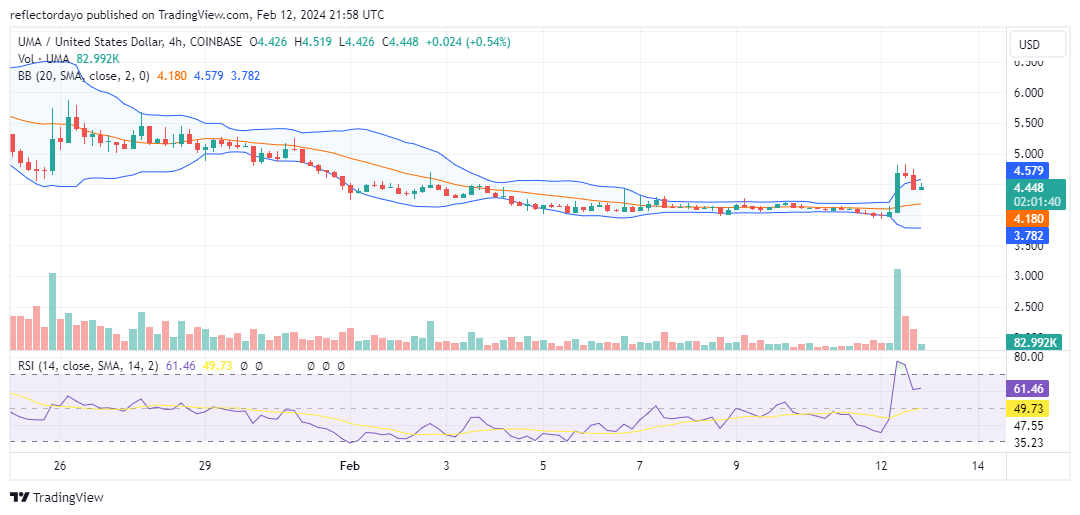
UMA/USD 4-Hour Chart Outlook
Upon closer examination of the market through a shorter timeframe lens, it becomes evident that, amid the price retracement, the bulls have effectively established a higher support level at $4.42. This strategic foothold not only fortifies the position of the bulls but also facilitates their pursuit of their target objectives. Nevertheless, it is worth considering that a decline in trade volume suggests the potential for price consolidation at this juncture before a breakout occurs.