Fetch.ai (FET/USD) Primed for a Rebound as It Stabilizes at $0.52 Support Level
Don’t invest unless you’re prepared to lose all the money you invest. This is a high-risk investment and you are unlikely to be protected if something goes wrong. Take 2 minutes to learn more
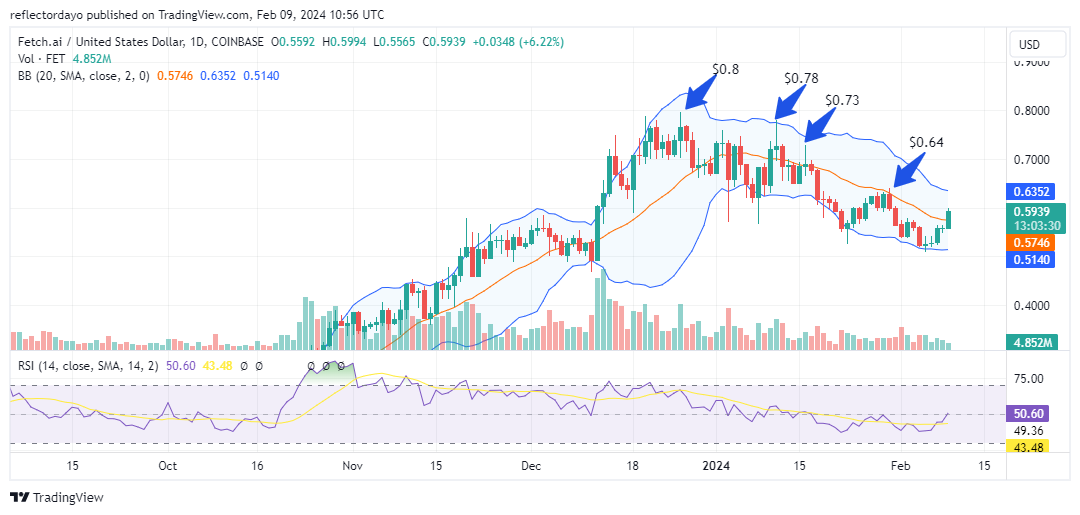
Following its peak at $0.80 on December 26, the Fetch.ai market has entered a bearish trend, characterized by a series of lower highs. Notable instances include $0.78 on January 11, $0.73 on January 14, and $0.64 on January 31. However, around the $0.50 support level, a notable confrontation between supply and demand ensued, culminating in a swift bullish breakout.
Fetch.ai Market Data
- FET/USD Price Now: $0.59
- FET/USD Market Cap: $48 million
- FET/USD Circulating Supply: 831 million FET
- FET/USD Total Supply: 1.2 billion FET
- FET/USD CoinMarketCap Ranking: #112
Key Levels
- Resistance: $0.60, $0.63, and $0.70.
- Support: $0.52, $0.50, and $0.45.
The Fetch.ai Market Analysis: The Indicators’ Point of View
Upon analyzing the chart, we observed a diminishing bullish momentum coinciding with the formation of new lower highs in the market. At the $0.60 price level, there was a noticeable decrease in overall trading volume, indicating a waning interest from both bullish and bearish traders. The crypto signal from the analysis suggests a decline in investor engagement. However, as the market approached the $0.50 price level, buying interest emerged among traders. Consequently, bullish sentiment prevailed, triggering a significant price rally.
Currently, attention is focused on overcoming the $0.600 resistance level, which may pose a challenge given the relatively modest height of the volume histograms according to the volume indicator.
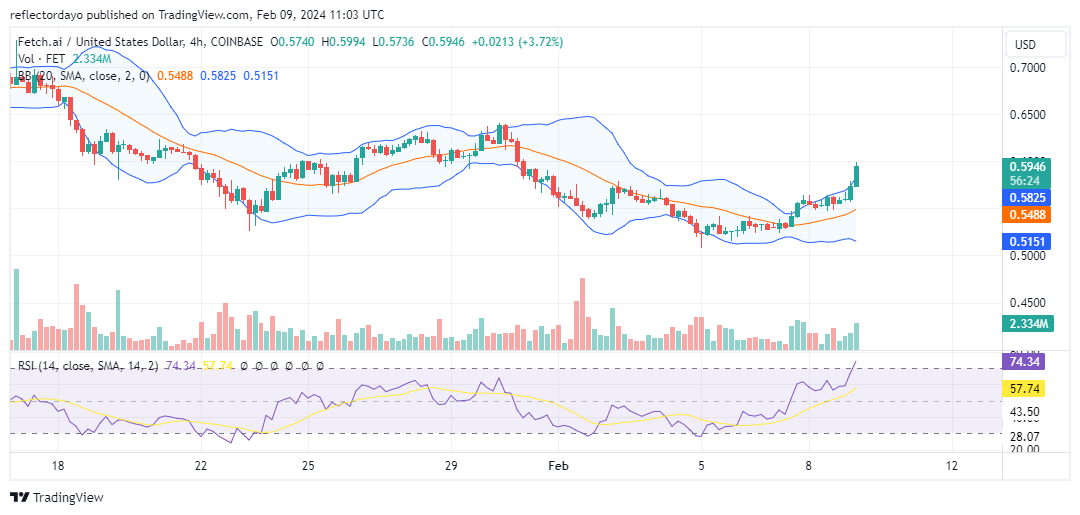
FET/USD 4-Hour Chart Outlook
Upon examining a smaller timeframe, the volume of trade histogram appears noteworthy, aligning with the current bullish market sentiment. Nonetheless, we observed the presence of bearish sentiment indicated by an upper shadow on the bullish candlestick at the $0.600 price level. Should bulls fail to secure a breakout beyond this point, a potential scenario could involve price consolidation near the $0.600 level to establish a robust foundation for overcoming bearish resistance.
