Sponge/USD ($SPONGE) Climbs New Higher Price Levels
Estimated Reading Time: 3 minutes
Don’t invest unless you’re prepared to lose all the money you invest. This is a high-risk investment and you are unlikely to be protected if something goes wrong. Take 2 minutes to learn more
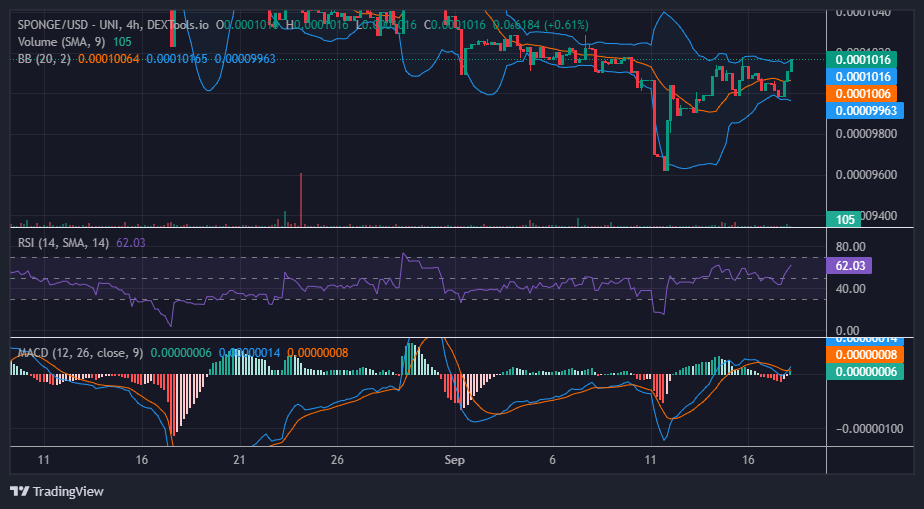
In light of the pronounced and rapid fluctuations occurring within a narrow price channel around the equilibrium level, we anticipate an imminent price breakout. During the transition from yesterday’s trading session to today’s, the SPONGE/USD market found support at the $0.000100 price level. Additionally, a series of three noteworthy bullish candles signals a significant upward movement, approaching a key resistance level in the bull market.
Key Levels
- Resistance: $0.000115, $0.000120, and $0.000125.
- Support: $0.00010, $0.000090, and $0.000080.
Sponge (SPONGE/USD) Price Analysis: Insights from Indicators
When significant price fluctuations occur within a narrow price channel, it often signals the potential for a breakout from that range. In the case of the SPONGE/USD pair, the breakout appears poised to move upward. This is evident in the consecutive formation of three bullish candles, a highly significant candlestick pattern indicating an imminent bullish breakout.
Additionally, the Relative Strength Index (RSI) is showing robust and significant momentum, currently measuring at 62. Furthermore, the MACD lines are positioned above the zero level in the Moving Average Convergence and Divergence (MACD) indicator. However, it’s worth noting that the upper band of the Bollinger Bands indicator has not yet reacted to this new market development.
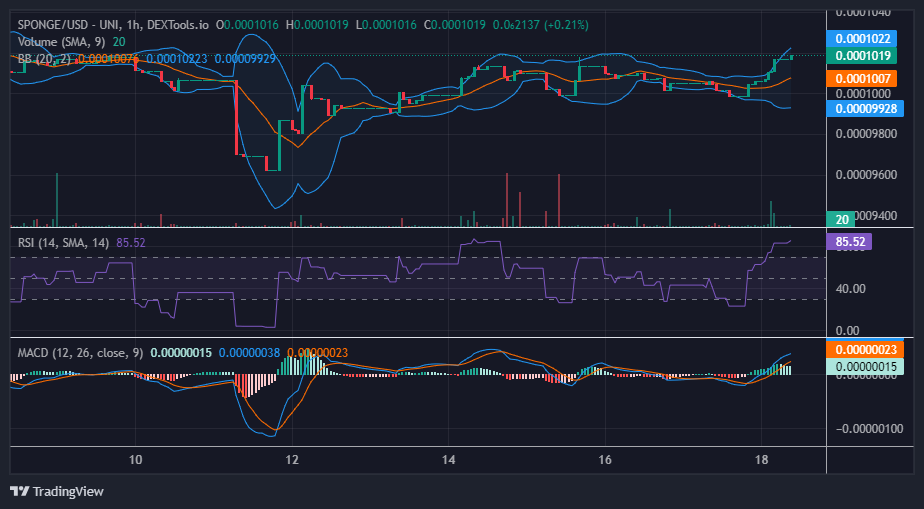
$SPONGE Short-Term Outlook: 1-Hour Chart
In a shorter timeframe, the Bollinger Bands have exhibited a notable response to the market’s evolution. The bands are diverging, signaling an increase in volatility. Nevertheless, this development has exposed the market to a significant bearish reaction, particularly as it ventures into overbought territory. If, however, the bullish sentiment persists, there is potential for the market to sustain its upward trend and remain within the overbought territory.
The SPONGE/USD token airdrop is still ongoing; take advantage of it.
Don’t miss out on the $SPONGE #Airdrop Season 1, ending in November!📆
Be sure to participate and savor the rewards while they last!🎁💰
Stay tuned for more upcoming announcements!📣
🧽Stay relaxed and soak up the damp with #SPONGE!💦
Join us here 🌐 https://t.co/lzRhjW4oLL pic.twitter.com/ESEUAIh31R
— $SPONGE (@spongeoneth) September 18, 2023
Invest in the hottest and best meme coin. Buy Sponge ($SPONGE) today!