Sponge/USD ($SPONGE) Initiates Uptrend, Ascending to New Price Levels
Estimated Reading Time: 3 minutes
Don’t invest unless you’re prepared to lose all the money you invest. This is a high-risk investment and you are unlikely to be protected if something goes wrong. Take 2 minutes to learn more
In the $SPONGE market, a mounting surge in buying pressure is instigating a sequence of higher lows, despite the steadfast resistance at $0.0001015. The emergence of these higher lows underscores the growing activity and willingness of buyers to acquire the instrument at increasingly elevated price points, reflecting an ascending trend indicative of a burgeoning bullish sentiment within the market.
Nonetheless, the unwavering resistance level implies a persistent effort from sellers to impede the instrument’s ascent.
Key Levels
- Resistance: $0.000115, $0.000120, and $0.000125.
- Support: $0.00010, $0.000090, and $0.000080.
Sponge (SPONGE/USD) Price Analysis: Insights from Indicators
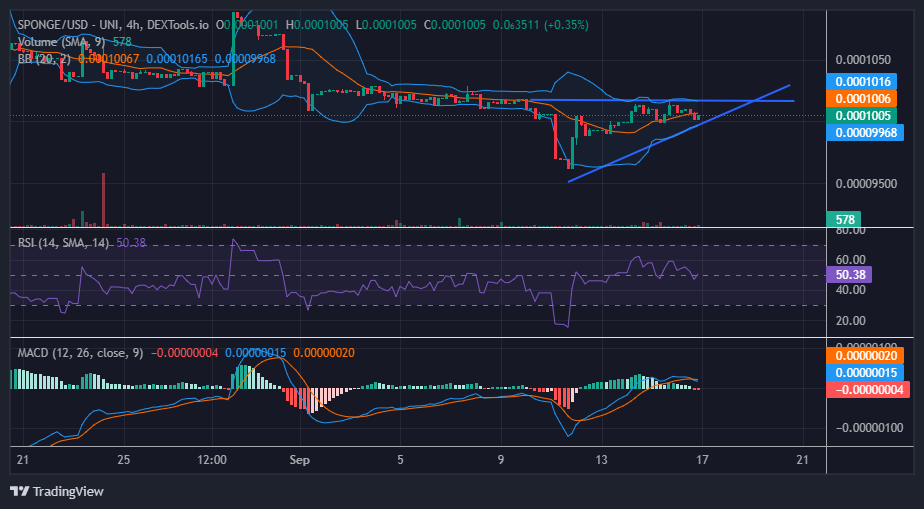
The $SPONGE trading pair is currently exhibiting the formation of an ascending wedge triangle pattern on the 4-hour chart. Ascending triangles, known as continuation patterns, typically foreshadow an upward breakout. As the price approaches the apex, where trendlines converge, the likelihood of an impending breakout intensifies. Traders frequently seek a decisive breach above the resistance level as a potential entry signal.
In the context of the Relative Strength Index (RSI), the market currently maintains a state of equilibrium. This equilibrium may stem from the ongoing conflict between bullish and bearish forces near the resistance level. If the consolidation persists and culminates at the apex, there is a potential for an upward breakout, particularly given the psychological significance of the $0.00010 price level.
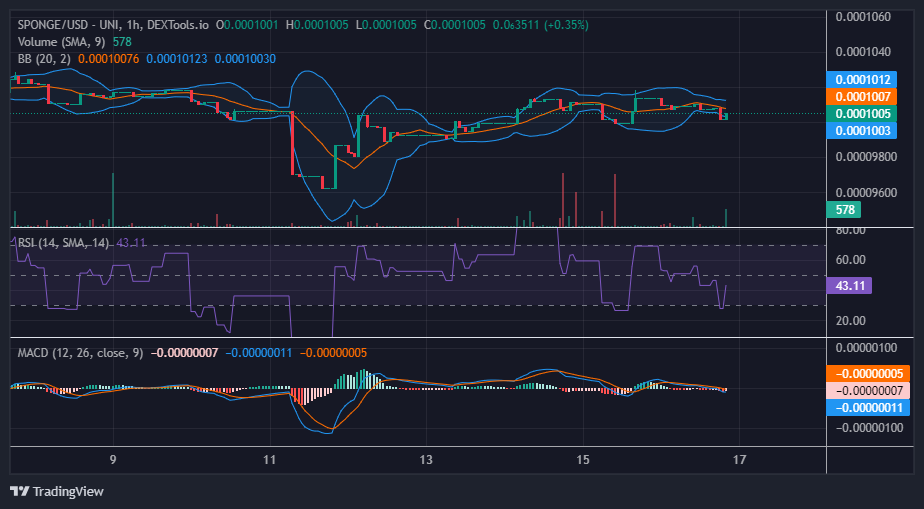
$SPONGE Short-Term Outlook: 1-Hour Chart
With each significant resistance level encountered, the bulls have successfully established consolidation zones at relatively modest or minimally lower levels, effectively creating pivot points that have facilitated the continuation of the primary market trend. However, since the market reached a pivotal resistance barrier, their ability to propel the market beyond this point has been challenged.
Furthermore, an ascending wedge triangle pattern has emerged on this 1-hour chart outlook, just as it has also appeared on the 4-hour chart, and this helps to reinforce expectations of an imminent price breakout. While ascending triangles are typically associated with bullish breakouts, it’s important to remain cautious as the risk of false breakouts persists. Traders are advised to exercise patience, awaiting a clear and sustained breach above the resistance level before initiating any trades.
Start your trading career on @gate_io and immerse yourself in the world of $SPONGE.
🧽 Submerge yourself in the $SPONGE universe and kickstart your trading journey on @gate_io!🚀
🧽Discover the ultimate #Memecoin and soak in all the damp!🌐🌊
🔗 Take your first step here – https://t.co/lDGSBf8kaO pic.twitter.com/tZgBcS4yrh
— $SPONGE (@spongeoneth) September 16, 2023
Invest in the hottest and best meme coin. Buy Sponge ($SPONGE) today!