Solana Price Prediction: SOL/USDT Gains Traction Above $210
Estimated Reading Time: 3 minutes
Don’t invest unless you’re prepared to lose all the money you invest. This is a high-risk investment and you are unlikely to be protected if something goes wrong. Take 2 minutes to learn more
Solana Price Prediction (January 17):
The $180 support level has remained steady in the Solana daily market. Additionally, the market has rebounded upwards, achieving key technical milestones. As a result, the price action is now approaching a medium-term resistance level.
SOL/USDT Long-Term Trend: Bullish (Daily Chart)
Key Price Levels:
Resistance: $220, $230, $240
Support: $210, $200, $190
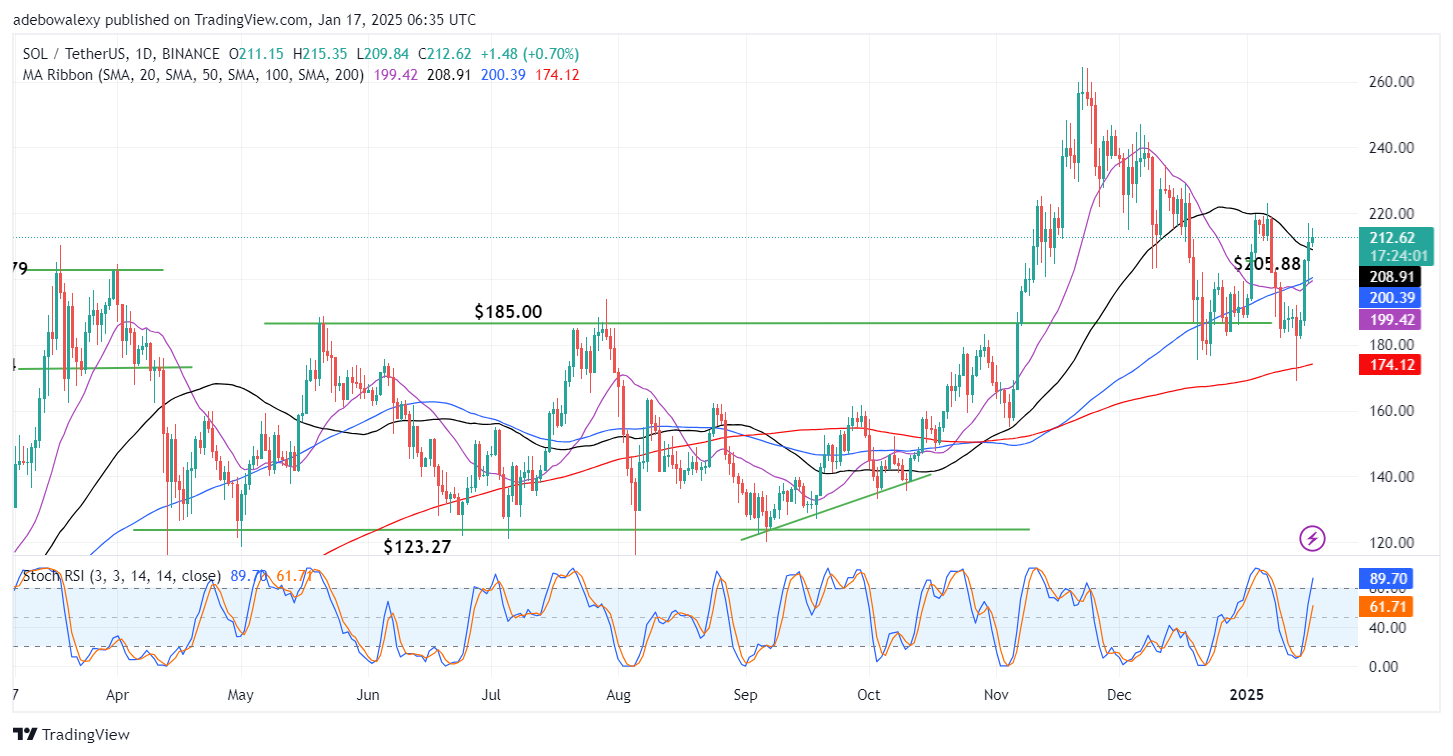
Price activity in the Solana daily market has risen above all the Moving Average (MA) lines on the chart. Consequently, the most recent price candle is positioned above all MA lines, signaling bullish momentum. The 20-day and 100-day MA lines recently crossed below the price action and are likely to produce another crossover soon. Meanwhile, the Stochastic Relative Strength Index (RSI) lines are rising sharply into the overbought region without showing signs of deflection.
Solana Price Prediction: SOL/USDT Bulls Eye $220 Resistance
The Solana market owes much of its recent upside recovery to strong bullish activity over the past two sessions. During these sessions, the market rebounded significantly, effortlessly breaching the $200 resistance level. While the momentum has moderated in subsequent sessions, the market remains bullish, with buyers appearing to target the $220 price level.
At this level, all MA lines are positioned below the price action, reinforcing bullish sentiment. Similarly, the Stochastic RSI indicates strong buying activity in the market. Although there has been some contraction, the latest price candle remains green. Therefore, prices are likely to continue trending higher in this market.
Solana Price Prediction: SOL/USDT Bulls Maintain Control as Upside Momentum Builds (4-Hour Chart)
In the Solana 4-hour market, bullish forces continue to dominate. Price action has been oscillating around the $210 mark, fluctuating between $210 and $220. The ongoing session remains bullish, as the 20-day and 100-day MA lines converge for a potential crossover below the price action.
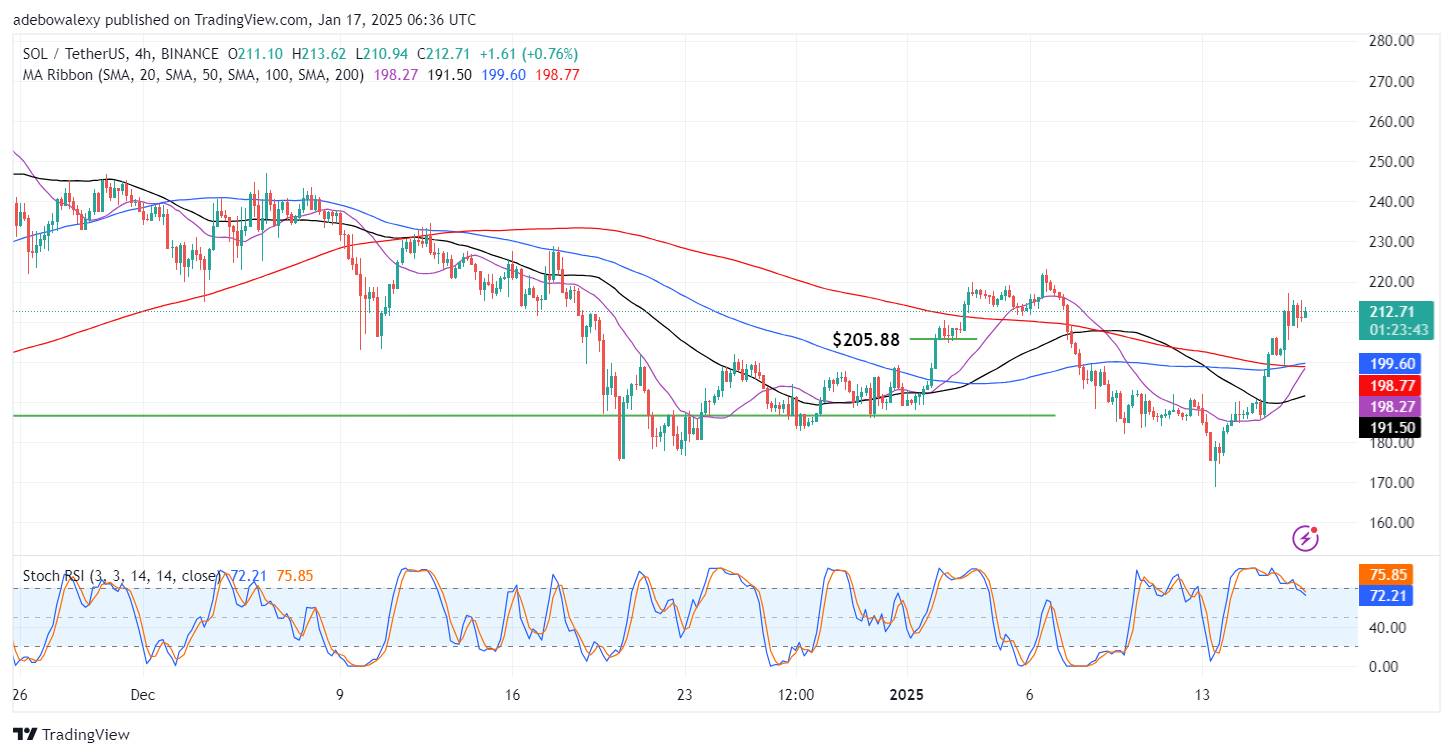
This setup strengthens the bullish outlook. However, the Stochastic RSI lines move slightly downward, signaling potential caution. Despite this, buyers are likely to remain vigilant, targeting the $220 resistance level.